Download
1 / 54
550 likes | 686 Vues
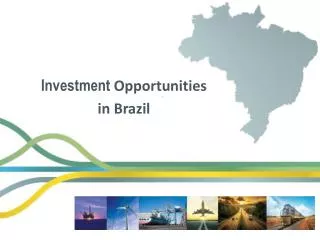
Investment Opportunities in the State of São Paulo. Investe São Paulo. Mission. Being the gateway to new investments or expansion of existing businesses, generating innovation, employment and income, in addition to the continuous improvement of the competitive environment and

E N D
Mission Being the gateway to new investments or expansion of existing businesses, generating innovation, employment and income, in addition to the continuous improvement of the competitive environment and of the image of the State of São Paulo
Areas of Activity • I – Investment Projects • Technical support and orientation to investors • Contact with public and private institutions aiming as investment facilitation • II – Business Prospection • Identification of sectors and companies with investment potential • III – Actions for the Promotion of Competitiveness • Labor training, Taxation, Innovation, Infrastructure and Licensing • Studying and proposing public policies • IV – Institutional Activities • Reception of foreign delegations and organization of international missions • Support and guidance for municipal governments • V – Promotion of the image of the State of Sao Paulo
Our Customers June 2012 Portfolio of projects Number of projects: 62* Potential Investments: USD 10 billion Potential direct jobs: 40 thousand Sectors: automotive, food, oil and gas, energy, solid waste and machinery and equipment. Origin: United States, China, South Korea, Spain, Japan, Italy, England, France and Brazil. * The names of these companies are kept confidential in compliance with NDA signed with Investe São Paulo Announced Investments: USD 6.8 billion Direct Jobs: 22.400 DABO Exchange rate: US$ 1 = R$ 1.67
Brazil, the 6th economy of the planet GDP - US$ billions 4th Germany 3,577 2,417 9th Russia 7th UK 1,850 10th Canada 1,736 2,198 2,776 12thSpain 5,870 15,094 8th Italy 1,493 7,298 5th France 3rd Japan 11th India 1st USA 1,676 2nd China 2,492 6th Brazil Source: IMF - year 2011
Selected Countries:Territory, Population and Economy Population > 100 million Territory > 3 million km2 Pakistan Bangladesh Russia India China Canada Australia Indonesia Nigeria United States Brazil Japan Mexico Germany France United Kingdom Italy South Korea Spain Netherlands Economy (GPD) > US$ 750 billion Source: IMF, World Bank - 2010
Brazilian Age Structure 2010 2020 2050 80 50 30 0 Opportunity Larger contingent of working-age population = possibility of increasing productivity Challenges Increase on health and social security expenditures Source: IBGE / Revista Veja, December 2010.
Social Mobility Year projection Millions of Inhabitants Source: Banco Central do Brasil/ FGV
Foreign Direct Investment into Brazil FDI in US$ billions Source: Brazilian Central Bank *Forecast based on the Inflation Report published in February 2012
Germany-Brazil and SP Economic Relations Source: Ministry of Development, Industry and Foreign Trade of Brazil Source: Brazilian Central Bank (1) Considering only stock purchases, excluding intercompany loans
Germany - Brazil and SP Economic Relations • São Paulo’s exports to Germany (2011) • Main Products and percentage of Brazil’s total • Nuclear reactors, boilers, machinery and mechanical appliance (53%) • Aircraft, spacecraft, and parts (99%) • Coffee, tea, maté and spices (9%) • Electrical machinery and equipment and parts (41%) • Natural or cultured pearls, precious or semi-precious stones (63%) • São Paulo’s imports from Germany (2011) • Main Products and percentage of Brazil’s total • Nuclear reactors, boilers, machinery and mechanical appliances (49%) • Electrical machinery and equipment and parts thereof; others (69%) • Vehicles other than railway or tramway rolling-stock, and parts and accessories thereof (43%) • Organic chemicals (70%) • Pharmaceutical products (61%) Source: Ministry of Development, Industry and Foreign Trade of Brazil
Brazil and São Paulo Brazil São Paulo 21% ofthepopulation 32% of GDP nominal 1,5 Xthe GDP per capita ofBrazil Source: IBGE, Brazilian Central Bank , SEADE – Exchange Rate US$ 1 = R$ 1,76
São Paulo Highlights • 1st largest cargo airport in Latin America • 1st largest producer of sugar cane ethanol in the world • 4th largest stock exchange in the world (BM&FBOVESPA) • 3rdlargest producer of aircraft in the world • 48% of domestic production of vehicles • Capital: third largest metropolis in the world • Agribusiness: Orange – 53% of juice world production Sugar – 23 million tons/year Beef – US$ 2.18 billion in exports
High Quality Infrastructure 19 out of the 20 best highways in Brazil Largest port in Latin America (Santos) 2,400 km of waterways 5,400 km of railways 6,000 km of gas pipeline Around 50 million air passengers per year And it is getting better... Investment in public transport (trains and subway) São Paulo Highway Ring Expansion of the ports of Santos and São Sebastião Expansion and modernization of 30 regional airports
Highway Railway Pipeline Waterway Airport Port High Quality Infrastructure Source: Transportation Secretariat of State of São Paulo
Environmental Responsibility • Energy matrix with 57% renewables (2010) • Competitive advantages for energy production from biomass • New opportunities in environmental technology markets • Brazil’s most advanced structured conservation system • 17.5% State area is native vegetation • 10.8% State area is rainforest • 14.8% State area is nature protection reserves (full protection and sustainable use) Source: Energy Secretariat of State of Sao Paulo, Forest Foundation
Index of Municipal Development The best ranked Brazilian municipalities are in the State of São Paulo 39 out of the 50 best ranked Brazilian municipalities are in the State of São Paulo Source: FIRJAN - Federation of Industries of the State of Rio de Janeiro Indices published in 2011 based on 2009 data
Higher Education 521 college level institutions all over the State 24% of Brazil’s total • The State Government is responsible for three of the best universities in Brazil: • USP - São Paulo University – 88,962 students • UNICAMP – Campinas State University – 36,801 students • UNESP – São Paulo State’s University – 46,634 students Source: USP, Unicamp. Unesp
Technological and Technical Schools Largest program of technical education in Brazil Technological education - Fatecs • 55 thousand students • 51 technology colleges • 60 courses in the fields of industry, services and agriculture Technical Schools - Etecs • 216 thousand students • 203 technical schools • 101 courses in the fields of industry, services and agriculture Workforce Training • Centro Paula Souza’s structure may be used for workforce training at no cost to companies Source: Centro Paula Souza – 2nd semester 2011
R&D / Innovation Fundação de Amparo à Pesquisa Científica e Tecnológica (Fapesp) More than 13% of the São Paulo State revenue is used in high quality education, research and development. The State also hosts federal universities and research institutions. US$ 512 million annual budget 3 universities among the ones that most develop scientificresearch in Brazil USP, Unicamp and Unesp 19 research institutes IPT internationalrecognition 30 initiatives of Technology Parks All over the state
R&D - Examples of Companies Examples of companies carrying out R&D in the State of São Paulo
Brazilian Investment Competitiveness Ranking December 2011 The Economist Economist Intelligence Unit
General Ranking Scale – 100 for best, 0 for worst STATES CLASSIFICATION REGION SOUTHEAST Very Good SOUTH CENTER WEST Good NORTHEAST NORTH Moderate Poor NATIONAL OVERALL #1 Source: The Economist, Centro de Liderança Pública and Veja http://veja.abril.com.br/infograficos/clp/
1.Economic Environment Scale – 100 for best, 0 for worst STATES CLASSIFICATION REGION SOUTHEAST Very Good SOUTH CENTER WEST Good NORTHEAST NORTH Moderate Poor NATIONAL OVERALL #1 Source: The Economist, Centro de Liderança Pública and Veja http://veja.abril.com.br/infograficos/clp/
2.Human Resources Scale – 100 for best, 0 for worst STATES CLASSIFICATION REGION SOUTHEAST Very Good SOUTH CENTER WEST Good NORTH NORTHEAST Moderate Poor NATIONAL OVERALL #1 Source: The Economist, Centro de Liderança Pública and Veja http://veja.abril.com.br/infograficos/clp/
3.Innovation Scale – 100 for best, 0 for worst STATES CLASSIFICATION REGION SOUTHEAST Very Good SOUTH CENTER WEST Good NORTHEAST NORTH Moderate Poor NATIONAL OVERALL #1 Source: The Economist, Centro de Liderança Pública and Veja http://veja.abril.com.br/infograficos/clp/
4.Policies for Foreign Investments Scale – 100 for best, 0 for worst STATES CLASSIFICATION REGION SOUTHEAST Very Good SOUTH CENTER WEST Good NORTH NORTHEAST Moderate Poor NATIONAL OVERALL SP MG #1 Source: The Economist, Centro de Liderança Pública and Veja http://veja.abril.com.br/infograficos/clp/
Pre-salt – Santos Basin Petrobras 2012-2016 Planned Investments US$ 236,5 billion 95% in Brazil
Tietê-Paraná Waterway • Estimated Investment • Total Investment – US$ 597 million • State Government – US$ 231 million • Federal Government – US$ 366 million • Summary of Investment • Elimination of Bottlenecks • Enlargement of spans and pillars protection • Dredging and removal of high points • Locks duplication • Extension • Expansion and rectification of the route • Ports on waterway Profile Navigation Extension 2,400 km total 800 Km in São Paulo State Linking the 5 largest states in production of grain, sugar cane and derivatives Source: São Sebastião Port Authority Exchange rate: US$ 1 = R$ 1.70
World Cup 2014 Public and Private Investment • US$ 180 million of state investments in transport infrastructure in the stadium surroundings • Arena for the opening of the World Cup - 65 thousand seats • Increase from 42 thousand to 50 thousand hotel rooms until 2014 • Connection of airports to subway and trains network • Improvement and expansion of the transportation system • 64 training centers preselected by the Local Committee, out of 145 nationwide Source: São Paulo State Government
Integrated Transport System in 2014 Source: GESP
São Paulo State Budget for PPPs Limited to 3% of net revenues, pursuant to Federal Law 11079/04 Expenditures with PPPs in 2010
Innovative Fast Track for PPP Projects • State Decree 57.289 dated August 30, 2011 allows interested investors to present proposals for PPPs Projects PRELIMINARY PPP PROPOSAL APPROVAL EVALUATION by State Commission PRIVATE SECTOR INITIATIVE (MIP) PUBLIC CALL for detailed technical studies, including alternatives REJECTION Technical studies $ Technical studies Technical studies PPP Project APPROVAL CONTRACT (PPP Project winner reimburses selected technical study author) PUBLIC BIDDING for the PPP EVALUATION by State Commission REJECTION
Line 6 – Orange of the Subway Network of São Paulo Source: Governo do Estado de São Paulo - Programa de Parcerias Público-Privadas - Conselho Gestor de PPP
Pharmaceutical Industry of Américo Brasiliense - IFAB Source: Governo do Estado de São Paulo - Programa de Parcerias Público-Privadas - Conselho Gestor de PPP
Line 18 – Bronze of the Metropolitan Network of São Paulo Source: Governo do Estado de São Paulo - Programa de Parcerias Público-Privadas - Conselho Gestor de PPP
Prison Units in the State of São Paulo Source: Governo do Estado de São Paulo - Programa de Parcerias Público-Privadas - Conselho Gestor de PPP
Interactive Class Source: Governo do Estado de São Paulo - Programa de Parcerias Público-Privadas - Conselho Gestor de PPP
Social Interest of Housing Source: Government of the State of São Paulo - Public-Private Partnership project (PPP) Program – Management Council of PPP
State Guarantee for Private Partners in PPPs “CompanhiaPaulista de Parcerias (CPP)”
Public Private Partnerships - Applicability Private Projects of interest to the Government Coordination, induction and stimulation PPP Sponsored Concession Regular Concession PPP Administrative Concession or Procurement of Public Works Financially self-sustaining projects Capacity to generate revenue Projects requiring government resources Traditional public projects
Highways Potential Investment: US$ 6.4 billion Highway Ring – North US$ 3.2 billion North Coast – Highways US$ 2.8 billion South Coast – Highways US$ 388 million Source: Secretariat of Logistics and Transports
Railways and Metro Potential Investment: US$ 5.6 billion Rail Ring US$ 1.2 billion Bandeirantes Express US$ 2 billion Airport Express andGuarulhos Train US$ 1.3 billion Other projects: US$ 1.1 billion Source: Secretariat of Metropolitan Transports, EMTU, CPTM, Secretariat of Transports