Download
1 / 16
160 likes | 264 Vues
NRC Air Quality Management Report: current AQM limitations. Despite substantial progress the Committee identified - in its comprehensive review of the Act - a number of limitations, for example: Inability to measure progress quantitatively to accurately confirm that goals are being met

E N D
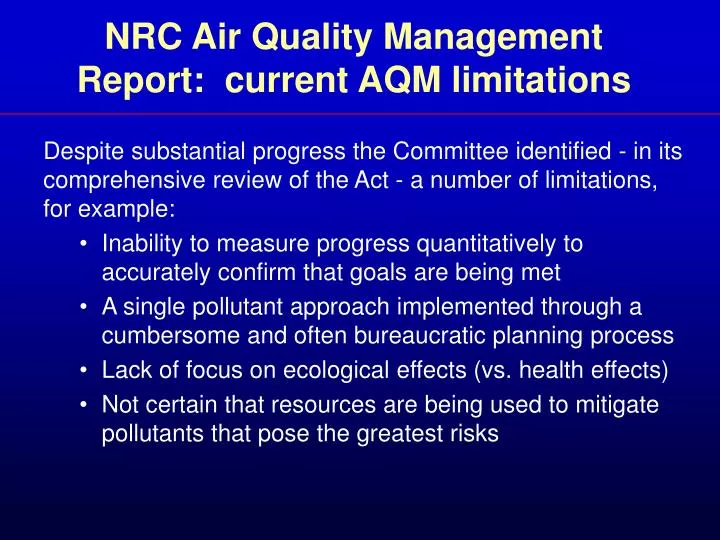
NRC Air Quality Management Report: current AQM limitations Despite substantial progress the Committee identified - in its comprehensive review of the Act - a number of limitations, for example: • Inability to measure progress quantitatively to accurately confirm that goals are being met • A single pollutant approach implemented through a cumbersome and often bureaucratic planning process • Lack of focus on ecological effects (vs. health effects) • Not certain that resources are being used to mitigate pollutants that pose the greatest risks
The Air Quality Management Process ESTABLISH GOALS • - National Ambient Air Quality Standards (NAAQS) • -Regional Haze • - Monitoring • - Inventories • - Data Analysis & Modeling DETERMINE NECESSARY REDUCTIONS DESIGN CONTROL STRATEGIES EVALUATE RESULTS Scientific Research • - National, Regional Rules • e.g. Mobile, NSPS • NOx SIP call, CAIR • - Develop State, Local, Tribal Plans • - Assess Progress • - Evaluate Effectiveness & Efficiency • - Revise Approach IMPLEMENT • - State Implementation Plans (SIPs) • - Permits • - Compliance & Enforcement
NRC: Challenges for Air Quality Management • Meeting NAAQS for O3 and PM2.5 and Reducing Regional Haze • Designing and Implementing Controls for Hazardous Air Pollutants • Protecting Human Health and Welfare in the Absence of a Threshold • Ensuring Environmental Justice • Assessing and Protecting Ecosystem Health • Mitigating Intercontinental and Cross-Border Transport • Maintaining AQM System Efficiency in the face of Changing Climate
Focus: PM – alone and with gases • Significant effects associations: • Premature death from heart and lung disease • Aggravation of heart and lung diseases, including asthma • Cardiac arrythmias and heart attacks • Coughing, wheezing and chronic bronchitis • And possibly lung cancer mortality, infant mortality • Is PM composition important? • Probably, but likely multiple “bad” actors • A number of studies found effects of PM components, e.g. sulfate; few OC, many black carbon (i.e. black smoke) • Implications for future NAAQS/Control approaches • Short-term (hours)/long-term/ composition-sources Current review of the NAAQS • Science assessment complete, staff and CASAC recommendations under considerations • Proposed decision December, final September 2006
Visibility and quality of life Urban: Winhaze model for Washington, DC. Top: Fine mass at the level of the current 24-hr NAAQS of 65 ug/m3 5 mile visual range, 39 deciview. Bottom: ~ Natural conditions, 90 mile visual range, 12 deciviews, less than 2.5 ug/m3. Urban Visibility - Secondary NAAQS Class I Areas: Regional Haze
Emerging health effects evidence on ozone • Premature mortality in elderly • Relationship between ozone levels and respiratory hospital admissions in children • Incidence of newly diagnosed asthma in children associated with outdoor activity & living in areas with high ozone exposures • Higher ozone exposures related to increased school absenteeism Current review of the NAAQS • In early phases of review of the Ozone criteria and standards
Areas Currently Designated as Nonattainment for PM2.5 and/or 8-Hour Ozone For further information on designations and related requirements, see http://www.epa.gov/air/oaqps/glo/designations/index.htm http://www.epa.gov/pmdesignations/
Sulfate Esti Ammonium Nitrate Carbonaceous Crustal PM/Ozone – Multiple Pollutants, Sources Multiple sources of multiple pollutants Pollutants contributing to PM2.5 and Ozone SO2 – Sulfate particles NOx – Nitrate PM, acid gases, formation of ozone and organic PM VOC – formation of ozone and organic PM VOC(C6unsat) – secondary organic PM NH3 – Ammonium Direct emissions of carbonaceous PM, crustal materials, metals CO – weak contribution to ozone formation Overlap of source types, VOC/PM components and ‘toxic’ air pollutants
Air Pollution Scales of Influence • Global – e.g. climate change, stratospheric ozone, persistent-bioaccumulative toxic pollutants (Hg, dioxins) • Regional – e.g. ozone, fine particles health, acid rain, visibility, nutrient loadings • Local –e.g. ozone, PM health, air toxics • Personal – indoor air/outdoor penetration, asthma NYC
Air Toxics - National Scale Assessment 1999 Predicted County Level Carcinogenic Risk Spatially, most of country predicted to have risk between 1 and 25 in a million Most urban locations greater than 25 in a million Transportation corridors and some locations greater than 50 in a million Several counties greater than 100 in a million
New findings on roadway pollution High exposure to ultrafine particles, CO, other pollution near roadway Increased risk near and on roadways
Assessing indirect strategies: “cool” cities • Trees aren’t just good to look at – they remove air pollution (ozone and PM) • They also emit VOC’s • And cool the environment reducing evaporative emissions from manmade sources • Air Policy Issue • Credit for enhancing tree cover • Penalty for eliminating trees?
International Tranport of Air Pollution GEOS-CHEM model, July 1997 North America (zero-out) Europe (zero-out) Asia (zero-out) Li et al. [2001, JGR]
Communications: Air Quality Index • Year Round 24/7 coverage/operations delivering real-time data (ozone & particles) for 46 States, 6 Canadian Provinces and all U.S. National Parks • Next-day AQI forecasts for over 300 cities (summer) and over 150 cities (year-round) • State-of-the-science information about air pollution health effects for the public, media and stakeholders • Public/Private partnerships with The Weather Channel, USA Today, CNN, weather service providers, NOAA National Weather Service, EPA’s Office of Env. Information
Expanding Accountability Exposure Human Health Effects Transport Transformation Air Quality Emissions Haze Deposition Current focus of AQM Process: Air quality monitoring, modeling, emissions inventories Expanded focus of AQM Process: To the extent feasible, track indicators of effects, exposure Terrestrial and Aquatic Ecosystem Effects Materials Damage
CAAAC Recommendations to Strengthen Scientific and Technical Capacity • Improve emissions measurements and reporting • Improve emissions factors and estimation methods • Quantify & reduce uncertainty in emissions inventories and air quality modeling applications • Promote & improve integrated, multipollutant monitoring • Develop an overall framework for accountability