Analysis of Variance: repeated measures
260 likes | 288 Vues
Learn about ANOVAs, their logic, and application in research, specifically One-way Repeated-Measures ANOVA. Understand the systematic vs. random variation, interpreting F-ratio, significance testing, and post-hoc analysis. Illustrative example on the effects of sleep deprivation on vigilance in air-traffic controllers provided.

Analysis of Variance: repeated measures
E N D
Presentation Transcript
Tests for comparing three or more groups or conditions: (a) Nonparametric tests: Independent measures: Kruskal-Wallis. Repeated measures: Friedman’s. (b) Parametric tests: One-way independent-measures Analysis of Variance (ANOVA). One-way repeated-measures ANOVA.
Logic behind ANOVA: ANOVA compares the amount of systematic variation (from our experimental manipulations) to the amount of random variation (from the participants themselves) to produce an F-ratio: systematic variation random variation (“error”) F =
Large value of F: a lot of the overall variation in scores is due to the experimental manipulation, rather than to random variation between participants. Small value of F: the variation in scores produced by the experimental manipulation is small, compared to random variation between participants. systematic variation random variation (“error”) F =
ANOVA is based on the variance of the scores. The variance is the standard deviation squared: variance In practice, we use only the top line of the variance formula (the "Sum of Squares", or "SS"): sum of squares We divide this by the appropriate "degrees of freedom" (usually the number of groups or participants minus 1).
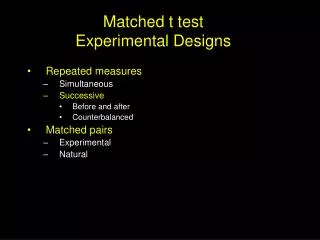
One-way Repeated-Measures ANOVA: Use this where you have: (a) one independent variable (with 2 or more levels); (b) one dependent variable; (c) each participant participates in every condition in the experiment (repeated measures). A one-way repeated-measures ANOVA is equivalent to a repeated-measures t-test, except that you have more than two conditions in the study.
Effects of sleep-deprivation on vigilance in air-traffic controllers: No deprivation vs. 12 hours' deprivation: One Independent Variable, 2 levels – use repeated-measures t-test. No deprivation vs. 12 hours vs. 24 hours: One Independent Variable, 3 levels (differing quantitatively) – use one-way repeated-measures ANOVA.
Effects of sleep deprivation on vigilance: Independent Variable: length of sleep deprivation (0, 12 hours and 24 hours). Dependent Variable: 1 hour vigilance test (number of planes missed). Each participant does all 3 conditions, in a random order. 0 hours: Mean = 4.6 standard deviation = 1.43. 12 hours: Mean = 13.0 standard deviation = 2.31. 24 hours: Mean = 13.3 standard deviation = 1.83.
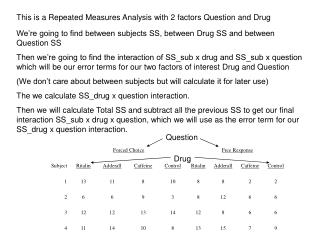
"Partitioning the variance" in a one-way repeated-measures ANOVA:
Another look at the table: Effects of sleep deprivation on vigilance within subjects variability between subjects variability 0 hours: Mean = 4.6 standard deviation = 1.43. 12 hours: Mean = 13.0 standard deviation = 2.31. 24 hours: Mean = 13.3 standard deviation = 1.83.
The ANOVA summary table: • Source: SS df MS F • Between subjects 48.97 9 5.44 • Within subjects 534.53 20 • Experimental 487.00 2 243.90 92.36 • Error 47.53 18 2.64 • Total 584.30 29 • Total SS: reflects the total amount of variation amongst all the scores. • Between subjects SS: a measure of the amount of unsystematic variation between the subjects. • Within subjects SS: • Experimental SS: a measure of the amount of systematic variation within the subjects. (This is due to our experimental manipulation). • ErrorSS: a measure of the amount of unsystematic variation within each participant's set of scores. • Total SS = Between subjects SS + Within subjects SS
Assessing the significance of the F-ratio (by hand): The bigger the F-ratio, the less likely it is to have arisen merely by chance. Use the between-subjects and within-subjects degrees of freedom to find the critical value of F. Your F is significant if it is equal to or larger than the critical value in the table.
Here, look up the critical F-value for 2 and 18 degrees of freedom Columns correspond to EXPERIMENTAL degrees of freedom Rows correspond to ERROR degrees of freedom Here, go along 2 and down 18: critical F is at the intersection Our obtained F, 92.36, is bigger than 3.55; it is therefore significant at p<.05. (Actually it’s bigger than the critical value for a p of 0.0001)
Interpreting the Results: A significant F-ratio merely tells us that there is a statistically-significant difference between our experimental conditions; it does not say where the difference comes from. In our example, it tells us that sleep deprivation affects vigilance performance.
To pinpoint the source of the difference: (a) planned comparisons - comparisons between groups which you decide to make in advance of collecting the data. (b) post hoc tests - comparisons between groups which you decide to make after collecting the data: Many different types - e.g. Newman-Keuls, Scheffé, Bonferroni.
Using SPSS for a one-way repeated-measures ANOVA on effects of fatigue on vigilance
Data entry
Tell SPSS about your within-subjects Independent Variable (i.e. number of levels; and which columns the levels of the independent variable are in):
Move VAR 4, VAR 5 and VAR 6 into the ‘Within-Subjects Variables’ box by pressing the top arrow; then press ‘options…’ button
The SPSS output (ignore everything except what's shown here!): Similar to Levene's test - if significant, shows inhomogeneity of variance.
SPSS ANOVA results: Use Sphericity Assumed F-ratio if Mauchly's test was NOT significant. Significant effect of sleep deprivation (F 2, 18 = 92.36, p<.0001) OR, (if Mauchly’s test was significant) use Greenhouse-Geisser (F 1.18, 10.63 = 92.36, p<.0001).
This is not too interesting; this just tells us that the subjects are significantly different from each other.