Lab Improvements
Lab Improvements. Look through the following slides to see what you should and shouldn’t be doing while writing labs. Problem. Make sure you have a ?.

Lab Improvements
E N D
Presentation Transcript
Lab Improvements Look through the following slides to see what you should and shouldn’t be doing while writing labs.
Problem • Make sure you have a ?. • Make sure you have a specific IV and DV (speed instead of faster; length, volume, circumference (etc.) instead of size; mass not weight when mass (g) is actually being measured and not the force due to gravity) • Make sure you mention the subject of the lab (car, marble, crater, block)!
Hypothesis • You hypothesis should state the trend you expect to see in the data. • Should be written as “If the IV does this (goes up or down) then the DV will do that. This will happen because… • Do not state If the IV changes then the DV will change – be specific! • Do not have a because statement that just restates how the IV is changing – use some background science info! • DO NOT start with “If the IV is tested” instead say “If the IV does this”. • If your IV leads to a bar graph you must mention all the changes to the IV (“If w, x, y & z are used to …”).
Titles!! • BOTH graphs AND data tables have titles. • Titles should be DV vs IV or The Effect of the IV on the DV • Titles should include units • Make sure the units in the title are the same as what you were actually measuring (don’t put cm in the title while meters is in the data table!) • You should mention the subject of lab (plane, hot wheels car) in the title. • Titles should be descriptive – there should be no question about what was happening in the lab!
Data Table • A title should be written above the data table!!!!!! • Both the IV and DV should be labeled with numbers (see the following data tables for examples)! • Averages need to have at least 2 decimal places. • Make sure that you round accurately! 0.66666666 rounds to 0.67 and 0.3333333 rounds to 0.33 • DO NOT write units next to numbers in data tables • Make sure you don’t spell Trial as Trail (and please include the word Trial and don’t just put 1, 2, 3)
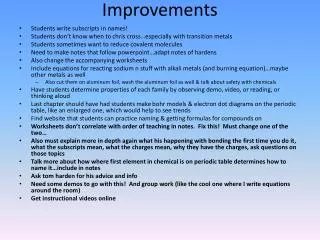
Improvements • There should be a title! • Units go in the IV and DV labels not next to the numbers. • The IV should be listed in order. • % change is missing
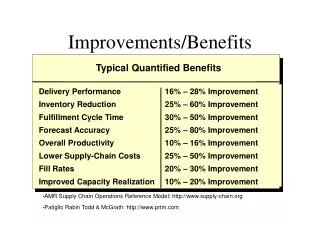
A Better Data Table The Effect of the Height (m) from Which a Basketball is dropped on the Number of Times the Basketball Bounces
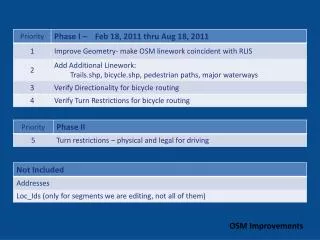
Improvements • The title should be DV vs IV or The Effect of the IV on the DV • % change should include a negative sign when decreasing. • The % change was calculated incorrectly • When doing % change for a non numerical IV you should compare the numbers to 1 IV variation (the “control”)
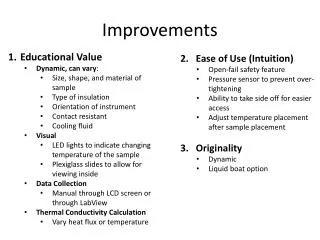
A Better Data Table Time (s) of Parachute Descent vs The Shape of the Parachutes For % change every number was compared to the square shape
Graphs • DO NOT use 6 (or 7 or 11…) boxes on a graph to represent a change of 5 units (or 1 unit)… why didn’t you choose 5 boxes (or 10)? (the spacing on a graph should make sense!!). • DO NOT start numbers at 8 then going up by 2…. Where is 0, 2, 4 and 6? • Make sure zero is on the x/y axis origin. • Make sure the spacing between 0 and the first number on an axis is the same distance as the spacing between the numbers on the rest of the graph. • Do not number the x axis on a line graph to look like a bar graph and do not put units next to these numbers!
Graphs • DO NOT connect your line to zero when there is no data point (0,0). • Please include tic marks on the axes to show exactly where the numbers are located. • Bar graph x axes should not have the IV variations in random locations… put the IV in order of smallest to largest DV (the bar heights would then be going up) if some other logical order can’t be found.
Improvements • The title should be DV vs IV or The Effect of the IV on the DV • While it is nicely showing the bars in increasing order, since the IV is a # this should be a line graph
Improvements • The X axis is not a number line!!! • Other bad # lines: • 30, 40, 50, 60 (this skips 10 and 20!) • 7, 14, 21, 28 (don’t choose random numbers or space so that you are using a random number of boxes as spacing)
Write a Trend for Each Graph • A: As the IV increases the DV increases. • B: As the IV increases the DV decreases. • C: In general, as the IV increases the DV increases. • D: As the IV increases the DV goes up and down therefore the IV does not have a significant or consistent affect on the DV. –or- The trend is inconclusive since as the IV increases the DV goes up and down repeatedly. A B C D E F
Write a Trend for Each Graph • E: The IV does not affect the DV since as the IV increases the DV increases from 50 to 50.1, which is not a significant change. • F: The trend is inconclusive since as the IV increases the DV goes down and up. The lowest DV is the 2 largest IV and the highest DV is the largest IV. A B C D E F
DO NOT Make These Common Mistakes in the Conclusion Questions • The use of I, me, us, we, our, the scientists. • Trend not mentioned in question 1. • Trend mentions something that was not measured in the graph… state what the graph looks like and how the actual IV relates to the DV… do not guess that the mass affects something if you did not measure mass. • Saying there is no trend instead of the trend is inconclusive (because the data goes up and down) or the IV does not affect the DV.
DO NOT Make These Common Mistakes in the Conclusion Questions • Putting numbers or an explanation of data in question 1 (it should be just the trend) or an explanation in question 2(you should just be supporting your trend with data here). You are doing more work than you need to! • Not mentioning any data, just saying “the data” or only writing 1 number for question 2. • Basically restating the data table in question 2 – you should COMPARE the data (this is twice that or this is showing a 32% increase or decrease).
DO NOT Make These Common Mistakes in the Conclusion Questions • Answers for question 3 that do not explain anything about the data, use incorrect information or have nothing to do with the lab. • Answers to question 3 that do not mention any science concepts. • Answers to question 3 that are 1 sentence long (example: the data happened because of gravity. And??? What does this mean??)
How to Improve Your Answer to Conclusion Question 3 • Sate a science concept that is involved in the lab. (example: momentum) • Explain the concept (definition, how it changes…). (Example: Momentum is mass in motion and is a product of mass and velocity. Therefore when either mass or velocity increases momentum increases.) • Explain how the concept is related to the lab. (Example: The object gained momentum when ______ happened because…) • Explain how the concept had an effect on the data. (Example: The increase in momentum would affect _______ because more momentum can be transferred to _________ causing __________ to happen which then caused…). Explaining this final connection is very important
DO NOT Make These Common Mistakes in the Conclusion Questions • Forgetting to answer 1 part of question 4 (There are THREE parts!!! 1. What is a source of error? 2. How can this error affect your data? 3. How can this error be minimized in the future?) • Writing sources of error that are avoidable or mistakes. • Just saying this error could affect the data but not explaining how. • Stating the error can be fixed by a machine instead of how we can actually try to minimize the error with what we have in the classroom. • Mentioning an IV that another group tested as the future experiment in question 5. • Mentioning a possible experiment that has nothing to do with the lab in question 5.