Explore UK Salary Percentiles on Figures.hr
0 likes | 48 Vues
Explore comprehensive insights into UK salary percentiles on Figures HR! Discover the latest data on average salaries in the UK, ranging from entry-level positions to top-tier executives. Our in-depth analysis provides a clear picture of income distribution, helping you make informed career and compensation decisions. Stay ahead in the job market with Figures HR's up-to-date salary percentile information.<br>

Explore UK Salary Percentiles on Figures.hr
E N D
Presentation Transcript
Explore UK Salary Percentiles on Figures.hr
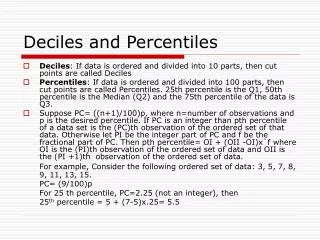
Average salary UK – a comprehensive overview The median UK salary is £31,461 and the mean UK salary is £36,834 per year. These numbers change significantly when you look at differences between industries, educational backgrounds, age, gender or regional differences. Along with job satisfaction, working conditions and career prospects, pay is one of the most important aspects of a job. For many people, their salary is the single most important factor in their professional lives. But do you know how your salary compares? Do you know where you stand compared to the average UK salary? Compared to the average salary in your industry? Of people with your education level? This article is shining a bright spotlight on these very questions and demystifying pay in the UK.
We’ll cover the following topics – do feel free to jump to whatever is most interesting to you: Average salary in the UK – overview Industry and occupation breakdown Influence of education level Average salary by age group Regional differences in the UK Gender pay gap What it all means for you We’ll dive right in but let’s just get our definitions straight before we do. Whenever we refer to salary or average UK salary, we mean total compensation. That is, base salary plus overtime pay, bonuses and any other components of work-related income (we’re not looking at non-work income such as rent income). Also, throughout the article, we are talking about gross salaries – so don’t compare these numbers with what hits your account but with the gross number on your pay slip. You can use an online tool to convert between the two.
All numbers refer to 2020 unless otherwise specified and are based on official ONS data. Self-employed people are not taken into account. And we’re only looking at salaries of full-time employees so if you only work 2 days a week, make sure to adjust for that. Finally a word on the average metric that we use in this article. There are two principal ways to measure an average – the mean and the median. Most people are familiar with the mean – it’s basically the sum of all observations divided by the number of observations. The median, on the other hand, is the mid-point, i.e. the observation which is both smaller and larger than 50% of observations. In this article, we will take the median as our principal measure so whenever you read about the average salary in the UK, read mid-point, not mean.
Overall salary stats – average UK salary and much, much more The average (read median) salary in the UK is £31,461 per year (£585.5 per week). The mean salary, on the other hand, amounts to £36,834 per year (£706.4 per week). So where does this sizable difference come from? Put simply, the mean is higher than the median because there are quite a few people who earn A LOT of money, but nobody who works full-time earns nothing. In other words, the outliers are much more extreme on the rich end than on the poor end. Look at it this way – Daniel Radcliffe made about £20 million in 2011 when he shot the last of the Harry Potter movies. That’s WAY more than you or I make and so it pulls the mean up by quite a lot. That doesn’t happen to the median, though, because for the median, Daniel Radcliffe is just one more person above the cut-off and it doesn’t matter by how much he is above. This insensitivity to extreme values is the reason why from now on, we will only be looking at the median as our measure of the average salary in the UK.
The table says that 10% of people in the UK make less than £18,586 – and vice versa 90% make more than that. That’s about £1’500 per month which is roughly equivalent to what you pay in rent for a studio in South Kensington. Conversely, 90% of people make less than £62,750 whereas the top-10% of earners make more than that. The chart also tells us that 50% of the full-time working UK population have an annual salary between £23,068 and £44,513. Now if you have recently graduated from uni and still “only” make £20,000 that doesn’t necessarily mean that your employer is ripping you off. Remember, this chart shows the salary distribution and the average salary across all people in the UK, meaning people who are much older or more experienced than you; people who live in more expensive areas of the country; or people who work in industries that generally pay higher salaries (but often also have more intense working hours). So let’s look at how all these factors influence pay and how the average salary in the UK looks on a more granular level.