Percentiles
Percentiles. Percentages. Latin roots Cent = one hundred Percent = by the hundred Comparing raw score with a conceptual scale of 100 points Provides a reference for any raw score in relation to the rest of the scores. Percentile.


Percentiles
E N D
Presentation Transcript
Percentages • Latin roots • Cent = one hundred • Percent = by the hundred • Comparing raw score with a conceptual scale of 100 points • Provides a reference for any raw score in relation to the rest of the scores
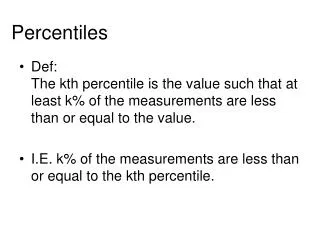
Percentile • “Defined as a point or position on a continuous scale of 100 theoretical divisions such that a certain fraction of the population of raw scores lies at or below that point.” • 75th percentile • 50th percentile • 33rd percentile
Percentile as a Standard Score • Standard score - score derived from raw data and has a known basis for comparison • Allows us to compare scores more easily • What is more meaningful? • Balance index of 3.5 • Score was in the 65th percentile
Standard Scores • Allow us to • Evaluate raw scores • Compare two sets of data that are based on different units of measure • Example • 3.5 on balance index • 120 Ft. lbs. of isokinetic torque in quadriceps
Problems of Interpretation • Problem occurs at extreme ends of the scale for data sets with large numbers of scores • Ceiling effect • Learning curve • Easier to make improvements at beginning and middle of curve • More difficult at top • Plateau in curve
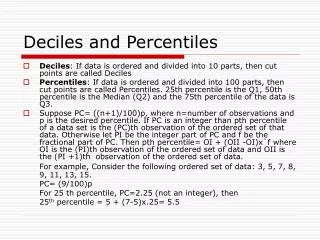
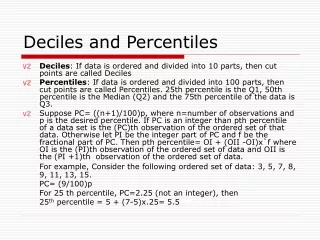
Common Percentile Divisions • Quartiles • Deciles
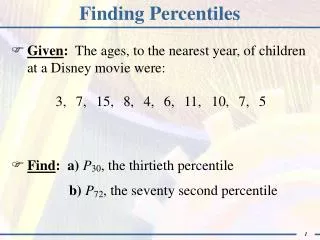
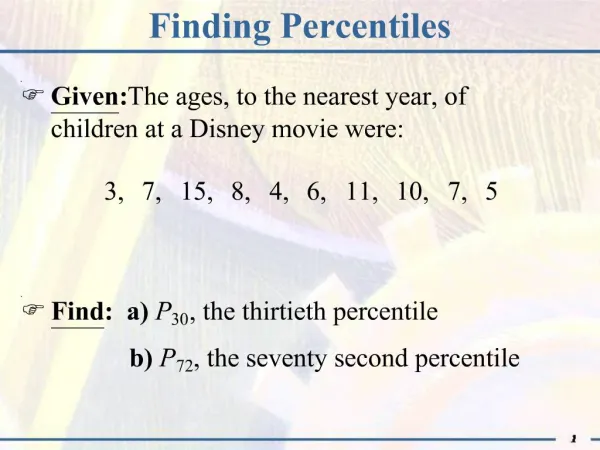
Calculating Using Percentiles • Rank order distributions • 10, 9, 9, 7, 7, 7, 6, 5, 5, 5, 4, 4, 3, 3, 1 • N = 15 • What percentile is the score 6? • What about 5? • What about 7? • Calculating raw score from percentile
Calculating Using Percentiles • Simple frequency distributions • add number in frequency column from score
Summary • Converting raw scores to standard scores is common • Standard scores allow us to compare 2 sets of data based on different units of measure • Percentile scores are most common standard score used