Download
1 / 18
190 likes | 363 Vues
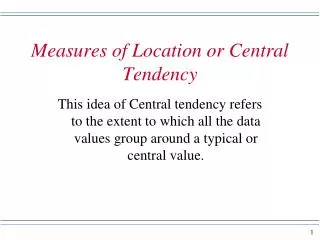
Measures of Central Location (Averages) and Percentiles. BUSA 2100, Section 3.1. Introduction. Values of a variable tend to cluster around a central point. A measure of central location indicates a center, average, or typical value.

E N D
Measures of Central Location(Averages) and Percentiles BUSA 2100, Section 3.1
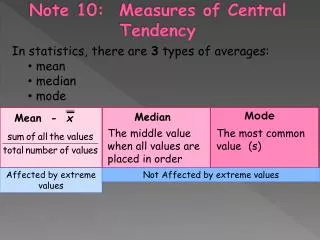
Introduction • Values of a variable tend to cluster around a central point. • A measure of central location indicates a center, average, or typical value. • A measure of central location (average) helps summarize data concisely with one value.
1st Type of Average: Mode • Definition:The mode is the item that occurs most often. • Example 1 – Consider this data set: {96,91,91,87,84, 82,79,75,72,69,62}. • The mode is 91 since it occurs twice. • But 91 isn’t a “central” or “typical” value. • Another problem: some data sets have no mode, e.g. set above with one 91 removed.
Mode (Page 2) • Some data sets have more than one mode. Example: Height of adults is bimodal (two modes). Why? • So the mode is not very useful and not reliable except for categorical data. • Example 2: (categorical data) Ask students to state their favorite kind of pie.
2nd Type of Average: Median • Definition: The median is the middle item of a ranked set of data. • It is the (n+1)/2 th item in a ranked set of n items. • Example 1: Find the median of this set of 7 items. {75,64,82,96,72,47,59}
Median (Page 2) • Example 2: Add 89 to the previous set. {89,75,64,82,96,72,47,59}
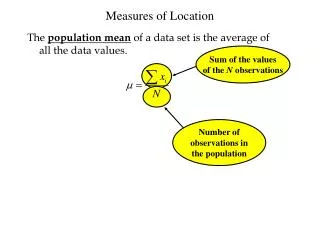
3rd Type of Average: Mean • Definition: The sample mean, X-bar = Sum of the X’s divided by n, where n = number of items in the data set (sample). • Example 1: {89,75,64,82,96,72,47,59}
Mean (Page 2) • Mean is the most widely used and best measure of central location except in one situation (to be discussed later). • Advantages of the mean: (1) More comprehensive because it uses all of the data (not just the center item(s)). • (2) Combined or weighted means can be calculated.
Mean (Page 3) • Example 2 (combined mean): Class #1 had a mean test score of 80; Class #2 had a mean test score of 60. • What is the overall mean for both classes combined? • Is it 70, the average of 80 and 60?
Mean (Page 4) • Class #1 has 40 students; Class #2 has 10 students.
Mean (Page 5) • Example 3 (weighted mean): In a course, a professor gives 3 tests and a final exam, and requires a project. • The final exam counts 1 1/2 times as much as each test and the project counts twice as much as each test. • Charles Malone made 80, 74, 67, 86, and 90. What is his course average?
Mean (Page 6) • Note: The unweighted mean is 79.4.
Mean (Page 7) • The median is preferred to the mean if there are extreme values present. • Example 4: Incomes for 5 families are: {$30K, $40K, $50K, $60K, $820K} • Mean = $1,000,000 / 5 = $200,000, but this is not a “center” or “typical” value. • Median = $50,000 (more accurate)
Percentiles • Definition: The pth percentile is a value that is > p percent of the values in a data distribution. • Values for p: 0, 1, 2,...,98, 99, 99.5, 99.9 • Example: If you were in the 86th percentile on a test, what does that mean?
Percentiles (Page 2) • Three steps for calculating percentiles: • (1) Arrange data in ascending order • (2) Calculate index (rank): i = (p/100)* n. • (a) If i is not a whole number, round up to the next whole number. • (b) If i is a whole number, use i + .5 . • (3) Identify the answer.
Percentiles (Page 3) • Example: {2450, 2500, 2650, 2430, 2355, 2260, 2490, 2680, 2540, 2775, 2525, 2465, 2610, 2390} are monthly salaries for 14 business graduates. • Find the 67th percentile. • Step 1: Arrange in ascending order: {2260, 2355, 2390, 2430, 2450, 2465, 2490, 2500, 2525, 2540, 2610, 2650, 2680, 2775}
Percentiles (Page 4) • Find the 50th percentile.
Percentiles (Page 5) • The 50th percentile is the median. • The 25th percentile is the 1st quartile. • The 75th percentile is the 3rd quartile.