Exploring Data Measures: Hudson Auto Repair & Pelican Stores
480 likes | 599 Vues
Discover the statistical measures of location and variability using examples from Hudson Auto Repair and Pelican Stores. Learn how to calculate mean, median, mode, percentiles, range, variance, and more.

Exploring Data Measures: Hudson Auto Repair & Pelican Stores
E N D
Presentation Transcript
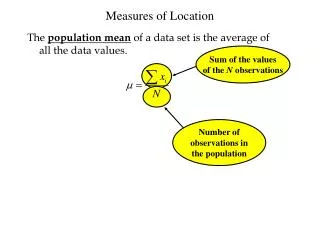
Measures of Location The population mean of a data set is the average of all the data values. Sum of the values of the N observations Number of observations in the population
Measures of Location The population mean of a data set is the average of all the data values. The sample mean is the point estimator of the population mean m. Sum of the values of the n observations Number of observations in the sample
Measures of Location Example: Recall the Hudson Auto Repair example The manager of Hudson Auto would like to have better understanding of the cost of parts used in the engine tune-ups performed in the shop. She examines 50 customer invoices for tune-ups. The costs of parts, rounded to the nearest dollar, are listed below. 3949 78.98 50
Measures of Location For an odd number of observations: 26 18 27 12 14 27 19 7 observations in ascending order the median is the middle value.
Measures of Location For an even number of observations: 30 26 18 27 12 14 27 19 8 observations in ascending order the median is the average of the middle two values. Median = (19 + 26)/2 = 22.5
Measures of Location Example: Hudson Auto Repair Averaging the 25th and 26th data values: Median = (75 + 76)/2 = 75.5 Note: Data is in ascending order.
Measures of Location Example: Hudson Auto Repair Mode = 62 Note: Data is in ascending order.
Measures of Location Example: Hudson Auto Repair First quartile = 25th percentile ith = (p/100)n = (25/100)50 = 12.5 = 13th First quartile = 69 Note: Data is in ascending order.
Measures of Location Example: Hudson Auto Repair ith = (p/100)n = (80/100)50 = 40th Average the 40th and 41st data values = 95 80th Percentile = (93 + 97)/2 Note: Data is in ascending order.
Measures of Location Example: Hudson Auto Repair: 80th Percentile 95 Note: Data is in ascending order.
Pelican Stores -- continued Pelican Stores is chain of women’s apparel stores. It recently ran a promotion in which discount coupons were set to customers of other National Clothing stores. Data collected for a sample of 100 in-store credit card transactions at Pelican Stores during one day while the promotion was running are shown in Table 2.18. Customers who made a purchase using a discount coupon are referred to as promotional customers and customers who made a purchase but did not use a discount coupon are referred to as regular customers. Because the promotional coupons were not set to regular Pelican Stores customers, management considers the sales made to people presenting the promotional coupons as sales it would not otherwise make. Pelican’s management would like to use this sample data to learn about its customer base and to evaluate the promotion involving discounts. Managerial Report Using graphs and tables, summarize the qualitative variables. Using graphs and tables, summarize the quantitative variables. Using pivot tables and scatter plots, summarize the variables. Compute the mean, mode, median, and the 25th and 75th percentiles.
Measures of Variability Example: Hudson Auto Repair Range = maximum – minimum Range = 109 – 52 = 57 Note: Data is in ascending order.
Measures of Variability Example: Hudson Auto Repair 3rd Quartile (Q3) = 89 1st Quartile (Q1) = 69 Interquartile Range = Q3 – Q1 = 20 = 89 – 69 Note: Data is in ascending order.
Measures of Variability The population variance is the averagevariation The population mean
Measures of Variability The population variance is the averagevariation i th deviation from the population mean
Measures of Variability The population variance is the averagevariation i th squared deviation from the population mean
Measures of Variability The population variance is the averagevariation Sum of squared deviations from the population mean
Measures of Variability The population variance is the averagevariation Total variation of x
Measures of Variability The population variance is the averagevariation Number of observations in the population
Measures of Variability The population variance is the averagevariation The sample variance is an unbiased estimator of s 2 Number of observations in the sample
Measures of Variability The population variance is the averagevariation The sample variance is an unbiased estimator of s 2
Measures of Variability The population variance is the averagevariation The sample variance is an unbiased estimator of s 2 Degrees of freedom
x = 78.98 Measures of Variability
Measures of Variability Example: Hudson Auto Repair Variance Standard Deviation Coefficient of variation
Pelican Stores -- continued Pelican Stores is chain of women’s apparel stores. It recently ran a promotion in which discount coupons were set to customers of other National Clothing stores. Data collected for a sample of 100 in-store credit card transactions at Pelican Stores during one day while the promotion was running are shown in Table 2.18. Customers who made a purchase using a discount coupon are referred to as promotional customers and customers who made a purchase but did not use a discount coupon are referred to as regular customers. Because the promotional coupons were not set to regular Pelican Stores customers, management considers the sales made to people presenting the promotional coupons as sales it would not otherwise make. Pelican’s management would like to use this sample data to learn about its customer base and to evaluate the promotion involving discounts. Managerial Report Using graphs and tables, summarize the qualitative variables. Using graphs and tables, summarize the quantitative variables. Using pivot tables and scatter plots, summarize the variables. Compute the mean, mode, median, and the 25th and 75th percentiles. Compute the range, IQR, variance, and standard deviations.
z-Score of Smallest Value Measures of Shape Example: Hudson Auto Repair Note: Data is in ascending order.
x = 78.98 Measures of Shape s = 13.992
Measures of Shape An important measure of the shape of a distribution is called skewness. It is just the average of the n cubed z-scores when n is “large”
18 16 14 12 10 8 6 4 2 Measures of Shape Tune-up Parts Cost Frequency Parts Cost ($) $75.50 $78.98 $62 50 60 70 80 90 100 110
Measures of Shape Symmetric Moderately Skewed Left skew = 0 skew = - .31 Highly Skewed Right skew = 1.25
Measures of Shape Chebyshev's Theorem: At least (1 - 1/z2) of the data values are within zstandard deviations of the mean. At least 0% of the data values are within 1 standard deviation of the mean At least 75% of the data values are within 2standard deviations of the mean At least 89% of the data values are within 3 standard deviations of the mean At least 94% of the data values are within 4standard deviations of the mean
Measures of Shape Empirical Rule: 68.26%of the data values are within 1 standard deviation of the mean 95.44% of the data values are within 2standard deviations of the mean 99.74% of the data values are within 3 standard deviations of the mean 99.99% of the data values are within 4standard deviations of the mean
Measures of Shape 49of the 50 data values are within 2 s of the mean = 98% 50of the 50 data values are within 3 s of the mean = 100% None of the values are outliers
Pelican Stores -- continued Pelican Stores is chain of women’s apparel stores. It recently ran a promotion in which discount coupons were set to customers of other National Clothing stores. Data collected for a sample of 100 in-store credit card transactions at Pelican Stores during one day while the promotion was running are shown in Table 2.18. Customers who made a purchase using a discount coupon are referred to as promotional customers and customers who made a purchase but did not use a discount coupon are referred to as regular customers. Because the promotional coupons were not set to regular Pelican Stores customers, management considers the sales made to people presenting the promotional coupons as sales it would not otherwise make. Pelican’s management would like to use this sample data to learn about its customer base and to evaluate the promotion involving discounts. Managerial Report Using graphs and tables, summarize the qualitative variables. Using graphs and tables, summarize the quantitative variables. Using pivot tables and scatter plots, summarize the variables. Compute the mean, mode, median, and the 25th and 75th percentiles. Compute the range, IQR, variance, and standard deviations. Compute the z-scores and skew, find the outliers, and count the observations that are within 1, 2, & 3 standard deviations of the mean.
Measures of the relationship between 2 variables The covariance is computed as follows: (for samples) (for populations)
Measures of the relationship between 2 variables The covariance is computed as follows: i th deviation from x’s means (for samples) (for populations)
Measures of the relationship between 2 variables The covariance is computed as follows: i th deviation from y’s means (for samples) (for populations)
Measures of the relationship between 2 variables The covariance is computed as follows: The sizes of the sample and population (for samples) (for populations)
Measures of the relationship between 2 variables The covariance is computed as follows: Degrees of freedom (for samples) (for populations)
Measures of the relationship between 2 variables The covariance is computed as follows:
Measures of the relationship between 2 variables Example: Reed Auto Sales Reed Auto periodically has a special week-long sale. As part of the advertising campaign Reed runs one or more television commercials during the weekend preceding the sale. Data from a sample of 5 previous sales are shown below. Number of TV Ads (x) Number of Cars Sold (y) 1 3 2 1 3 14 24 18 17 27
35 30 25 20 15 10 5 0 1 0 2 3 4 Measures of the relationship between 2 variables Example: Reed Auto Sales Cars sold TV Ads
Measures of the relationship between 2 variables Example: Reed Auto Sales x y (x – x)2 (y – y)2 y – y (x – x) x – x (y – y) - - - - - 1 3 2 1 3 14 24 18 17 27 14 24 18 17 27 20 20 20 20 20 - - - - - 1 3 2 1 3 2 2 2 2 2 1 1 0 1 1 6 4 0 3 7 36 16 4 9 49 100 . 10 . 4. 114 . 20. 5 5 4 4 4 y syy sxx x = 20 = 1 = 28.5 = 2 = 5 sxy (cars) (ads) (ads-cars) (cars squared) (ads squared) sy sx = 1 = 5.34 (cars) (ads)
Measures of the relationship between 2 variables Example: Reed Auto Sales = 5 sxy (ads-cars) sy sx = 1 = 5.34 (cars) (ads) (ads-cars) (cars) (ads)
Pelican Stores -- continued Pelican Stores is chain of women’s apparel stores. It recently ran a promotion in which discount coupons were set to customers of other National Clothing stores. Data collected for a sample of 100 in-store credit card transactions at Pelican Stores during one day while the promotion was running are shown in Table 2.18. Customers who made a purchase using a discount coupon are referred to as promotional customers and customers who made a purchase but did not use a discount coupon are referred to as regular customers. Because the promotional coupons were not set to regular Pelican Stores customers, management considers the sales made to people presenting the promotional coupons as sales it would not otherwise make. Pelican’s management would like to use this sample data to learn about its customer base and to evaluate the promotion involving discounts. Managerial Report Using graphs and tables, summarize the qualitative variables. Using graphs and tables, summarize the quantitative variables. Using pivot tables and scatter plots, summarize the variables. Compute the mean, mode, median, and the 25th and 75th percentiles. Compute the range, IQR, variance, and standard deviations. Compute the z-scores and skew, find the outliers, and count the observations that are within 1, 2, & 3 standard deviations of the mean. Compute the covariances and correlations.