Download
1 / 17
190 likes | 426 Vues
Measures of Location. Prepared by: Josefina V. Almeda Professor and College Secretary School of Statistics University of the Philippines, Diliman August 2009. Learning Objectives. After the session, participants should be able to: To list and define the most common measures of location

E N D
Measures of Location Prepared by:Josefina V. AlmedaProfessor and College SecretarySchool of StatisticsUniversity of the Philippines, DilimanAugust 2009
Learning Objectives After the session, participants should be able to: • To list and define the most common measures of location • To demonstrate and apply the use of measures of location; • Interpret results obtained from each measure.
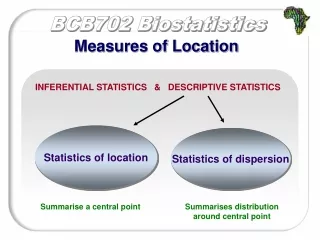
Measures of Location • Percentiles • Quartiles • Deciles
Percentiles * Percentiles divide the ordered observations into 100 equal parts. * There are 99 percentiles, denoted by P1, P2, P3, …, P99 with around 1% of the observations in each group. We read and interpret the individual percentiles as follows: P1, read as first percentile, is the value below which 1% of the ordered values fall. P2, read as second percentile, is the value below which 2% of the ordered values fall. : P99, read as ninety-ninth percentile, is the value below which 99% of the ordered values fall.
Thus, Pk is a value such that at least k% of the ordered data are smaller than it and at least (100-k)% are larger than it, where k = 1, 2, 3, …, 99. For example, the 80th percentile of a distribution is a value such that at least 80 percent of the ordered observations are less than its value and at least 20 percent of the ordered observations are larger than its value.
How to Compute for Percentiles * arrange the data in ascending order before getting the percentile * assume that all observed values exist and that there is no missing data * let be the ordered observations arranged from lowest to highest * denote the percentile we are interested with k Example: if we want to compute the 75th percentile, then k = 75. If we want the 90th percentile, then k = 90.
Empirical Distribution Number with Averaging Two Cases in Getting the Percentile: 1. If is an integer, Pk = 2. If is not an integer, Pk is the ith data item in the ordered observations where i is the closest integer greater than Pk corresponds to the percentile that we want to find, where k = 1 to 99 and n is the number of observations.
Examples of Getting the Percentile Using the Empirical Distribution Number with Averaging • The annual per capita poverty threshold in pesos of the different regions of the Philippines are as follows: 15,693, 13,066, 12,685, 11,128 13,760, 13,657, 11,995, 11,372, 11,313, 9,656, 9,518, 9,116, 10,503, 10,264, 10,466, 10,896, 12,192. Find the 75th percentile.
Solution: Arrange the 17 annual per capita poverty threshold in pesos of the 17 regions of the Philippines from lowest to highest. Array: 9116, 9518, 9656, 10264, 10466, 10503, 10,896, 11128, 11313, 11,372, 11995, 12192, 12,685, 13066, 13657, 13760, 15,693 Compute for nk/100 where n = 17 and k = 75. nk/100 = 17(75)/100 = 12.75 (not an integer) Since nk/100 is not an integer, we use the second formula in the empirical number distribution with averaging. The 75th percentile is 12,685. This implies that 75% of the 17 annual per capita poverty threshold falls below P12,685.
The following are the number of telephone lines of 16 • regions for the year 2004: 2799079, 94079, 190335, 42860, 410841, 1049413, 125157, 427497, 470299, 151652, 35945, 147513, 295334, 82616, 117116, 33315. Find the 50th percentile. • Solution: Arrange the observations from lowest to highest. • Array: 33315, 35945, 42860, 82616, 94079, 117116, • 125517, 147513, 151650, 190335, 295334, • 410841, 427497, 470299, 1049413, 2799079
Compute for nk/100 where n = 16 and k = 50. nk/100 = 16(50)/100 = 8 (integer) Since nk/100 is an integer, we use the first formula of the empirical number distribution with averaging. P50 = Thus, 50% of the 16 regions have number of telephone lines lower than 149,582.
Quartiles • 3 value that divide an ordered data sets into 4 • equal parts • Split Ordered Data into 4 Quarters • the ith quartile, Qi is a value below which 25x i % of the data lie 25% 25% 25% 25% Q1 Q2 Q3 =
The Quartiles * The upper quartile denoted by Q3 have the highest observed values of the data set. It divides the bottom 75% of the ordered observations from the top 25%. * The middle quartile denoted by Q2 contains the next highest observed values of the data set. It divides the bottom 50% of the ordered observations from the top 50%. * The lower quartile denoted by Q1 have the lowest observed values of the data set. It divides the bottom 25% of the ordered observations from the top 75%. Thus, Qk where k = 1,2,3 is a value such the k% of the ordered data are smaller in value than this.
Relationship of Quartiles and Percentiles * first quartile or lower quartile is the 25th percentile; * second quartile or the median is the 50th percentile; and * third quartile or the upper quartile is the 75th percentile. * Quartiles are special cases of percentiles. Thus, the formulas we have for the percentiles are applicable for the quartiles.
D5 D3 D1 D6 D4 D2 Deciles • 9 values that divide an ordered data set into 10 equal parts • The ith decile, Di is a value below which 10 x i % of the data lie 10% 10% 10% 10% 10% 10% 10% 10% 10% 10% D7 D9 D8
The Deciles We read and interpret the deciles as follows: D1, read as first decile, is the value below which 10% of the ordered values fall. D2, read as second decile, is the value below which 20% of the ordered values fall. : : D9, read as ninth decile, is the value below which 90% of the ordered values fall.