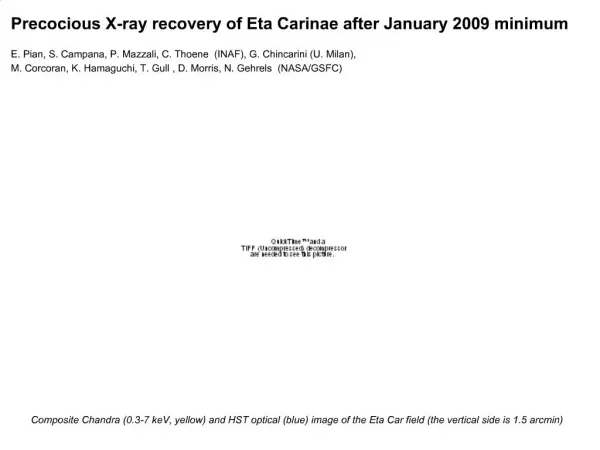
Download
1 / 35
350 likes | 525 Vues
X-ray Line Diagnostics of Shocked Outflows in Eta Carinae and Other Massive Stars. M. F. Corcoran. Overview. Introduction: Problems of Mass and Mass Loss X-ray Fine Analysis as a Probe of Mass Loss Mass Outflows and Shocks: a) Embedded Wind Shocks in single stars

E N D
X-ray Line Diagnostics of Shocked Outflows in Eta Carinae and Other Massive Stars M. F. Corcoran
Overview • Introduction: Problems of Mass and Mass Loss • X-ray Fine Analysis as a Probe of Mass Loss • Mass Outflows and Shocks: a) Embedded Wind Shocks in single stars b) Colliding Wind Shocks in binaries • Summary and More Questions
Introduction: The Masses of Massive stars Mass is the fundamental stellar parameter but as it increases it becomes (observationally) less well constrained Moffat 1989
Weight Loss Secrets of the Stars • Mass is lost due to • radiatively driven stellar winds • Transfer/Roche Lobe leaks • Eruptions • Explosions… Mass Loss: Crucial impact on Evolution Meynet & Maeder 2003
Problems Measuring Mass Loss • Smooth wind vs. clumped? (Mass-loss rates obtained from P V wind profiles are systematically smaller than those obtained from fits to Hα emission profiles or radio free-free emission by median factors of ~20–130, Fullerton, Massa & Prinja 2006) • spherical or not? • eruption: timescales & rates? • explosion: core & remnant amounts? Beginning to End…
X-ray Studies of Mass Loss • All observed OB stars in the range B2V–O2I are X-ray emitters • Thermal X-rays arise from at least 3 (non-exclusive) shock processes: • embedded wind shocks from unstable line driving • wind-wind collisions in binaries • magnetically-confined wind shocks • X-rays sensitive to detailed mass loss process: • Shocks depend on density and velocity as f(r) • continuum and lines sensitive to overlying opacity
Some Observed X-ray Properties • For single OB stars, Lx α 10–7 Lbol (known since days of the Einstein Observatory) • Single WR stars very weak X-ray sources Naze et al.2011 Chandra Carina Project O stars B stars • Broadly Speaking: • Emission thermal; kT < 1 keV for single O stars; lots of emission lines • Single stars: X-ray emission non-variable (but see q2 Ori A, Schulz et al. 2996, Mitschang et al. 2009) • Binaries: may be harder (kT>2 keV); brighter; variable
Questions • What is the spatial distribution of the shocked gas in the stellar wind? • What is the temperature distribution vs. radius? • What does the shocked gas tell us about the detailed mass loss process (mass loss rates, velocity laws, unstable regions, large-scale vs. small-scale clumps)
Tools: High Energy High Resolution Spectrometry • Stellar wind velocities (1000-3000 km/s) generate distribution of X-ray emitting gas in the Chandra/XMM band (0.2-10 keV) • Shocked gas generates thermal X-ray line emission useful for detailed measures of wind flow & densities • High-energy lines particularly important since inner winds have high optical depth at soft X-ray energies (E<1 keV) • HETG spectroscopy provides a unique tool: • energy band matches wind dynamics • spectrally resolve broad lines, esp. at high energies • spatially resolve clustered stars
Diagnostics see Porquet, Dubau, Grosso 2011
a) Embedded Wind Shocks • radiative driving force which generates winds in OB and WR stars unstable to Doppler shadowing (Lucy & White 1980, Feldmeier 1997) • Wind should break up into slow dense clumps embedded within a lower density, fast wind • collisions produce shock heated gas dependent on local velocity field • Temperatures typically millions of K since shocks expected to occur in wind acceleration zone close to the star • Opacity of overlying wind beyond the acceleration zone should reduce the red-shifted portion of the line relative to the blue shifted portion, dependent on wind density
Line Profiles • Widths: narrow to broad • in general FWHM << 2x wind velocity • Centroids: zero to negative blueshifts • No redshifts? • Symmetric or Asymmetric?
Single Star Summary • Lines broad but only 0.2 < HWHM < 0.8 (Gudel & Naze 2009) • EMX << EMwind • Profiles (apparently) symmetric; centroids show small blueshifts (exc. Zeta Pup). • Opacities low; wavelength-dependent? • Lines apparently form rather deep in the wind (Ro~1.5-1.8 R*) • Zeta Pup: opacity wavelength dependent, but profiles require a reduction of a factor of 3 in mass loss rate (Cohen et al. 2010)
b) Eta Car and WR 140: The Thermal Spectra of Colliding Winds Long-Period, eccentric colliding wind systems are excellent laboratories for studying: • the development of astrophysical shocks • the physics of line formation • the process of mass loss in more than 2 dimensions • Key properties: • location of X-ray emitting volume constrained to the wind-wind shock boundary • In eccentric systems, variations of density (at constant temperature) around the orbit • clumping-free mass loss rates? Pittard 2007
Eta Carinae: LBV+?, P=5.5yr V-Band Lightcurve 50 yrs “Great Eruption” A. Damineli 5.5 yr 1820 1850 1880 1910 1940 1970 2000
Eta Car: Orbital and Wind Geometry 3D SPH model (Okazaki et al. 2008)
Eta Car: X-ray Variations Sampling with HETG
MEG Spectral Variations Hotter than single star Highly variable Emission variations Normalized here Absorption variations
Line Formation Radial Velocities: lines become more blueshifted near periastron as the shock cone sweeps past the line of sight Model showing the location of maximum emissivity of the Si XIV line along the shock boundary (Henley et al. 2008)
F/I ratios Eta Car Zeta Pup
HETG Results • Strong changes in continuum flux and lines • lines of high ionization potential show smaller blueshifts than lines of lower IP • high IP lines form close to stagnation point where electron temperature is higher • variations in centroid velocities of Si & S lines • probably due to changing orientation of bow shock to line of sight • possible transient emission associated with RXTE flares? (Behar et al. 2005) • R=F/I ratio is above the low-density limit • ionization from inner shell of Li-like ion in NIE plasma? • excitation to n>3 levels followed by radiative cascades? • Charge exchange?
Results: Iron • Broad, Variable Fe K fluorescence • X-ray scattering by wind • Fe XXV “satellite lines” which increase in strength near periastron • cooling (via conduction?) due to the growth of dense cold instabilities • dust formation? • Fe XXV & Fe K profile nearly identical in 2 near periastron observations separated by 1 cycle.
WR140: Shock Physics Lab Courtesy P.M. Williams
Chandra phase-dependent grating spectra of WR140 (2009-01-25) WC O 2006-04-01 (,D/a,)=(2.649,1.77,-36) apastron Courtesy Andy Pollock 2008-08-22 (,D/a,)=(2.951,0.59,+2) O-star 2000-12-29 (,D/a,)=(1.987,0.23,+44) periastron
WR140 phase-dependent MEG spectra • T~5keV electron continuum 80% • lines 20% • WC abundances periastron =1.987 O-star =2.951 apastron =2.649 Courtesy Andy Pollock
XUVOIR : WR140 NeX MEG line profiles Courtesy Andy Pollock Courtesy P.M. Williams periastron =1.987 O-star =2.951 apastron =2.649 Apastron: view flow from both sides of shock cone; velocity equilibrium? Periastron: emission from leading arm suppressed – due to changes in cooling? O-star conjunction: emission from near side of shock cone dominates
Conclusions & Questions • Embedded shock emission from single stars suggest that most of the shocked gas exists deep in the wind near the wind acceleration region • Mass loss rates need to be reduced • How general is the wavelength dependence of X-ray line opacity? • Importance of radiative instabilities/NEI effects in X-ray line formation in binaries • change in shock physics/cooling near periastron in Eta Car and WR 140 • (Very) small R ratios in long-period binaries vs. large R ratios in single stars • Evidence for ionization stratification along the shock boundary in colliding-wind systems • No double-peaked profiles in CWBs: simple conical picture too simple? Other Issues: • magnetic fields & collisionless plasmas • close, late-type companions • satellite lines • charge exchange
X-ray Line Emission: Observed Trends • Declining trend of X-ray ionization with stellar spectral type and weakening of H- to He-like ratios (Walborn et al. 2009) dwarfs supergiants g Cas giants pec. HD 93250 z Pup q1 Ori C z Oph t Sco Walborn et al. 2009
Summary of Grating Observations • how many massive stars have grating observations? (hetgs, letgs, rgs) • how many need these observations? • Tools: • TGCAT: • XATLAS:http://cxc.cfa.harvard.edu/XATLAS Relatively small number of stars observed at high resolution, so hard to make firm conclusions regarding trends in line formation properties and connection to winds and stellar properties
Dichotomy: 1 vs 2 • Single and Binaries: different sources of emission: • Single stars: embedded shocks at some fraction of the wind terminal velocity. Produced by instabilities in radiative wind driving force; “clumping” • Binaries: Shocked gas produced by the collision of the wind of one star and that of its companion; also (I) above Studies of X-ray emission from single and binary stars provide complementary information regarding stellar mass loss (and more generally the production of X-rays in shocks)
Examples: Zeta Pup & Zeta Ori • Perhaps the best-studied massive star at high X-ray spectral resolution • Zeta Pup: O4If, N overabundance compared to C, O • Zeta Ori: O9.7Ib • Strong thermal line emission • Mdot ~ 10-5 M yr-1 based on H-α line Issues: • Lines much less blueshifted and more symmetric than expected given high Mdot • Also high-temperature X-ray lines (S XV) deep in wind; but how deep?
Zeta Pup Line Analysis • X-ray wind opacity: grey (large, dense clumps) vs. wavelength-dependent (small, optically thin clumps) • Kramer et al. (2003) analysis of HETG spectrum: X-ray optical depth nearly independent of wavelength: large, dense clumps • Cohen et al. (2010) re-analysis, including short-wavelength lines: X-ray optical depth IS dependent on wavelength; • requires ~factor of 3 reduction in Mdot • lines form near 1.5 R* • Short wavelength lines at high S/N key probes of the inner wind