Download
1 / 1
10 likes | 109 Vues
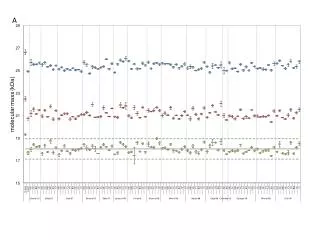
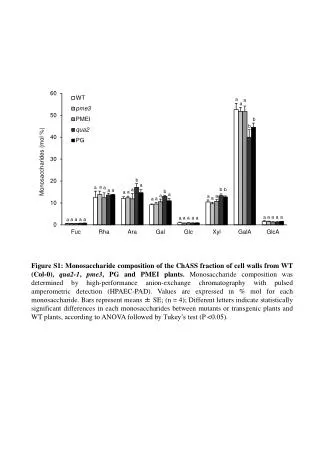
Explore monosaccharide composition differences in plant cell walls from WT, qua2-1, pme3, PG, and PMEI plants using HPAEC-PAD analysis. Statistical significance shown between mutants and WT plants.

E N D
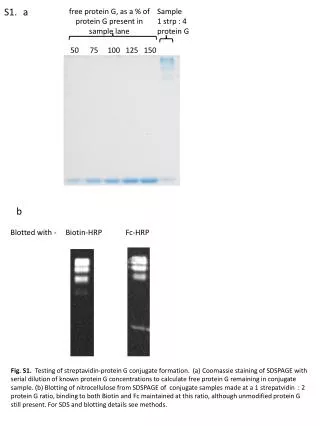
a a a b b b a a a a b b a a a b a a a a a a a a a Figure S1: Monosaccharide composition of the ChASS fraction of cell walls from WT (Col-0), qua2-1, pme3, PG and PMEI plants. Monosaccharide composition was determined by high-performance anion-exchange chromatography with pulsed amperometric detection (HPAEC-PAD). Values are expressed in % mol for each monosaccharide. Bars represent means ± SE; (n = 4); Different letters indicate statistically significant differences in each monosaccharides between mutants or transgenic plants and WT plants, according to ANOVA followed by Tukey’s test (P <0.05). a a a a a a a a a a a a a a a


![[S1]](https://cdn2.slideserve.com/4310044/slide1-dt.jpg)