Download
1 / 3
30 likes | 172 Vues
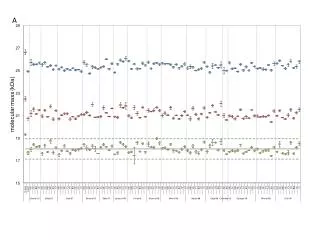
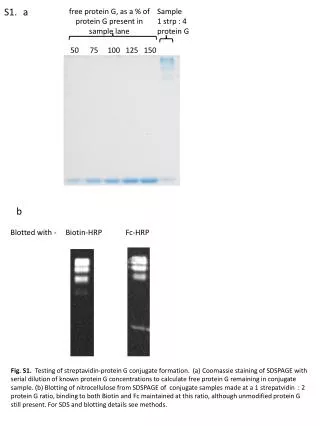
A. B. Additional file 1: Molecular masses and relative intensities of PrP res moieties of all animals with more than one brain region available.

E N D
Additional file 1: Molecular masses and relative intensities of PrPres moieties of all animals with more than one brain region available. The investigations were conducted like written in Fig. 2. a) Average molecular masses of the unglycosylated (green), the monoglycosylated (red) and the diglycosylated band (blue) of PrPres are displayed with the related S.E.M. b) Average relative band intensities. The L-type (green square) is the sole sample that fell below the critical limit of 55% (dashed line). H-type is displayed as a red triangle. If available, the following brain regions were analyzed: medulla oblongata at the level of the obex (MO), cerebellar cortex (CC), midbrain (MB), hippocampus (HC), parietal lobe (PL), thalamus (TH), basal ganglion (BG), cortex frontalis (CF), cortex occipitalis (CO) and cortex temporalis (CT).


![[S1]](https://cdn2.slideserve.com/4310044/slide1-dt.jpg)