Download
1 / 18
180 likes | 380 Vues
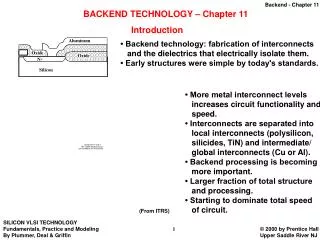
G. Comoretto. Backend electronics for radioastronomy. Data processing of a radioastronomic signal. Receiver ( front-end ) Separates the two polarizations Amplifies the signal by ~10 8 Limits the band to a few GHz Translates the sky frequency to a more manageable range

E N D
G. Comoretto Backend electronics for radioastronomy
Data processing of a radioastronomic signal • Receiver (front-end) • Separates the two polarizations • Amplifies the signal by ~108 • Limits the band to a few GHz • Translates the sky frequency to a more manageable range • The resulting signal is then processed by a back end Electric field E(t) Power density S(f) to backend
Data processing of a radioastronomic signal • Measure S as a function of time, frequency, polarization status, baseline • Total power • Polarimetry • Spectroscopy • Interferometry • Pulsar (search and timing) • Record the instantaneous field E(t) for further processing • VLBI/ Remote interferometry • Radio science • Composite of the above (e.g. spectropolarimetric interferometry)
Signal conversion • IF output may be too wide • Difficulties of building wideband backends • Necessity of having several spectral points across the IF bandwidth (e.g. for Faraday rotation) • Interest in a specific spectral region (e.g. line spectroscopy) • Necessity to avoid contaminated portion of the IF band • Baseband converters (BBC): select a portion of the IF bandwidth and convert it to frequencies near zero • Each BBC followed by a specific backend (total power, polarimeter, spectrometer, VLBI channel....)
Total power • Simplest observable: total integrated flux over the receiver bandwidth • Filter: selects the frequency band of interest • Square law detector: diode (simpler, wideband) or analog multiplier (more accurate, expensive, band limited) • Integrator: sets integration time: time resolution vs. ADC speed • ADC: converts to digital. Integrator & ADC are often implemented as a voltage-to-frequency converter & counter
Total power • Sensitivity: • t = integration time • Df = bandwidth or frequency resolution • S = total (receiver dominated) noise • For modern receivers, 1/f gain noise dominant for t > 1-10 s • need for accurate calibration & noise subtraction • Added mark • Correlating receiver • On-the fly mapping • Wobbling optics
Polarimetry • Dual polarization receiver: vertical/horizontal or left/right • Cross products give remaining Stokes parameters • Instrumental polarization: 30dB = 0.1% • Bandwidth limited by avaliable analog multipliers • Need for coarse spectroscopic resolution (Faraday rotation)
Spectroscopy • Acousto-optic spectrometer: • signal converted to acoustic waves in a crystal • diffraction pattern of a laser beam focussed on a CCD • amplitude of diffracted light proportional to S(f) • Large bandwidth, limited (1000 points) resolution • Rough, compact design • All parameters (band, resolution) determined by physical design => not adjustable
AOS Array for Herschel - HiFi • LiNb cell with 4 acoustic channels • Instantaneous band: 4x1.1 GHz (4 – 8 GHz) • Resolution : 1 MHz
Spectroscopy – Digital correlator • Digital spectrometers: • Bandwidth determined by sampling frequency • Max BW technologically limited, currently to few 100MHz • Reducing sampling frequency decreases BW = > increased resolution • Autocorrelation spectrometers (XF) • Compute autocorrelation function: • Fourier transform to obtain S(f) • Frequency resolution: • Signal quantized to few bits (typ. 2) • Complexity proportional to N. of spectral points
Spectroscopy – FFT spectrometer • FFT spectrometers: • Compute spectrum of finite segment of data • Square to obtain power and integrate in time • Complexity proportional to log2(N) => N large • Requires multi-bit (typ. 16-18 bit) arithmetic • Easy to implement in modern, fast FPGA, with HW multipliers • Slower than correlator, but keeping pace • Polarimetric capabilities with almost no extra cost
Spectroscopy – FFT spectrometer • Poly-phase structure: multiply (longer) data segment with windowing function => very good control of filter shape • Very high dynamic range (106-109) => RFI control
Interferometry • Visibility function: <E1(t)*E2(t+t)> • Computed at distant or remote location: need for physical transport of the radio signal • Directly connected interferometers • Connected interferometers with digital samplers at the antennas and digital data link • E-VLBI: time-tagged data over fast commercial (IP) link • Conventional VLBI: data recorded on magnetic media • Accurate phase and timing control
Interferometry • Visibility computed on dedicated correlator or FFT processor • Conventional correlator scales as (number of antennas)2 • FFT (FX) scales as N • Must compensate varying geometric delay: • Varying sampler clock • Memory based buffer, delay by integer samples • Phase correction in the frequency domain • Due to frequency conversion, varying delay causes “fringe frequency” in the correlation ALMA correlator (1 quadrant)
Digital vs. Analog Backend • All backend functions can be performed on a digital signal representation • Current programmable logic devices allow to implement complex functions on a single chip • Digital system advantages: • predictable performances – easy calibration • high rejection of unwanted signals - RFI • Better performances, filter shapes etc. • Easy interface with digital equipments Example of a general-purpose full digital backend
Digital vs. Software Backend • Software backends (e.g. SW correlator) becoming possible • e.g Blue Chip IBM supercomputer viable as LOFAR correlator • Most Radio Science processing done on software • Computing requirements scale as a power of the BW • Dedicated programmable logic still convenient • 1 FPGA: 50-500 MegaOPS, ~16 FPGA/board • MarkIV correlator (in FX architecture): 1.7 TeraOPS • EVLA Correlator: 240 TeraOPS
Digital Backend: Examples • ALMA Digital filterbank: • 2 GHz IF input • 32x62.5 MHz independently tunable BBC • General purpose board, can be configured to implement 16 FFT spectropolarimeters @ 125 MHz BW each
Digital Backend: Examples • VLBI dBBC: • 1 GHz IF input • 250 MHz output bandwidth • Directly interfaces with E-VLBI • BEE2 Berkeley system • 1 GHz IF input • General purpose board, with library of predefined components • System design and validation using MATLAB