Download
1 / 6
60 likes | 146 Vues
Supplementary figures. Garcia_Figure S1. A. B. Q0. Q24. Q0. Q24. Q35. Q40. Q35. Q40. wt rm7. wt rm7. wt. wt rm7. wt rm7. wt. wt rm7. wt rm7. YFP (27KDa – 33KDa). -Tubulin (50KDa).

E N D
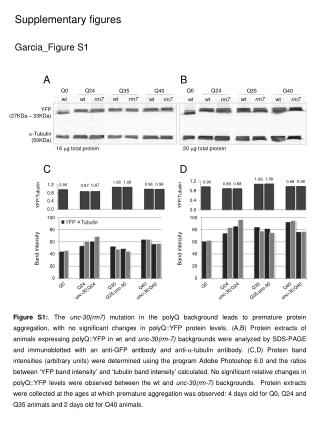
Supplementary figures Garcia_Figure S1 A B Q0 Q24 Q0 Q24 Q35 Q40 Q35 Q40 wt rm7 wt rm7 wt wt rm7 wt rm7 wt wt rm7 wt rm7 YFP (27KDa – 33KDa) -Tubulin (50KDa) 16 mg total protein 20 mg total protein C D Figure S1:. The unc-30(rm7) mutation in the polyQ background leads to premature protein aggregation, with no significant changes in polyQ::YFP protein levels. (A,B) Protein extracts of animals expressing polyQ::YFP in wt and unc-30(rm-7) backgrounds were analyzed by SDS-PAGE and immunoblotted with an anti-GFP antibody and anti--tubulin antibody. (C,D) Protein band intensities (arbitrary units) were determined using the program Adobe Photoshop 6.0 and the ratios between ‘YFP band intensity’ and ‘tubulin band intensity’ calculated. No significant relative changes in polyQ::YFP levels were observed between the wt and unc-30(rm-7) backgrounds. Protein extracts were collected at the ages at which premature aggregation was observed: 4 days old for Q0, Q24 and Q35 animals and 2 days old for Q40 animals.
e2327 Q35 rm7 N2 unc-30 act-4 Kb Kb 0.9 2.0 0.7 1.7 Garcia_Figure S2 B A unc-30 (rm7) N2 Figure S2. Characterization of unc-30(rm7) allele.(A) Amplification by PCR was performed for the unc-30 genomic region containing the rm7 mutation. N2 samples display the expected band size, approximately 2Kb, and unc-30(rm7) samples exhibit a smaller PCR product, approximately 1.7Kb, indicating the presence of a deletion. (B) RT-PCR amplification of unc-30 for N2, unc-30(e2327), unc-30(rm7) and Q35 RNA samples. Amplification revealed the presence of a smaller transcript for the unc-30(rm7) strain. No transcript was detected for the null unc-30(e2327). Amplification of actin (act-4) was used as a control.
1,914 MDDNTATLTAIHQQQQSHNRFSNPLVCVGQLDHHSLLPEHSISSSLAPLTHNPYAFNYSIPLPPTDITTKLPKLELLSLDVKQEQDDNHLDTSSPTDSTGNGSTNGGKIQKPRRQRTHFTSHQLTELENWFSRNRYPDMACREEIAVWISLTEPRVRVWFKNRRAKWRKRERNYVIDNGQGTTKVTAQSLDPLGSLQNTFPQTLLQSSSSQLDDSAVTSSSFYGYGGAWQQNPYYSRNNQTTFNWQIKPQFQTIPMSPTTATSRFSTAANLAPLPTAQAAFSTSATSSNDKLKLMDGLSNSLSSSLGQPYQPCQYSGPL* Garcia_Figure S3A Garcia_Figure S3B Figure S3: The rm7 mutation causes a in frame deletion in the gene unc-30.Represented in Fig.S3A is the unc-30 DNA sequence from exon 4 (position +1,914) up to beginning of intron 7. Exons are highlighted in orange and introns in yellow. Box area indicates the rm7 deletion of 347bp. Represented in Fig.S3B is the amino acid sequence of UNC-30. The rm7 deletion region is indicated in bold, corresponding to the 54 amino acids coded by exon 5. Stripped box indicates homeobox domain.
Garcia_Table S1: Table S1: Q35 and Q40 animals in a GABA- and egl-19-mutant backgrounds display a premature aggregation onset. Numbers represent t1/2, which indicates the average age at which animals reach 50% maximal aggregation, calculated using a sigmoidal time response curve with a non-linear slope. t1/2 was calculated using data set from figures 2F, 2G and 3B, respectively. Values indicate average SEM.
Garcia_Figure S4 A Q35;egl-19(n582) Q35 * * Number of aggregates * * Days old B Q35;unc-93(e1500) Q35 Number of aggregates * * Days old Figure S4: Decreases in excitation or in general Ca2+ influx into body wall muscle cells causes a decrease in Q35 aggregation. Animals were synchronized and age-dependent accumulation of aggregates determined by fluorescent microscopy. (A) Decrease in Ca2+ entry in body wall muscle cells leads to a decrease in Q35 aggregation. (B) A decrease in body wall muscle excitation leads to a decrease in Q35 aggregation. The strains analyzed were Q35, Q35;egl-19(n582) (A) and Q35;unc-93(e1500) (B). Q35;unc-93(e1500) animals were not scored beyond day 5 given that the unc-95(e1500) mutation causes nematodes to bag and die. Each column represents a minimum of 35 animals (range 35-80) (A) and 55 animals (range 55-71) (B). Error bars indicate SEM, (*) corresponds to a p<0.01.
Garcia_Figure S5 Control Compound B A GABA C Lindane D Q GABAR GABA F E Neuron Muscle cell ACh Lindane AChR G H Levamisole Nicotine I J Levamisole K L M N Nicotine O P Figure S5: One day old (L1s) Q35 animals were treated with 200mM GABA (B and D), 1mM lindane (F and H), 25M levamisole (J and L) or 1mM nicotine (N and P). Shown in the panels are untreated control animals (A, E, I and M) and treated animals (B, F, J and N). The white boxes indicate magnified areas shown in C, D, G, H, K, L, O and P. Panels A-D correspond to 6 days old and panels E-P correspond to 4 days old animals. Scale bars: A, B, E, I and M =200m, C, D, F, G, J, K, N and O = 100m, H, L and P = 50m. Shown in Q is a schematic representation of neuronal signaling at the neuromuscular junction and how the compounds tested affect GABA or ACh signaling in muscle cells.


![[S1]](https://cdn2.slideserve.com/4310044/slide1-dt.jpg)