
Uploaded by
varen
3 SLIDES
162 VUES
30LIKES
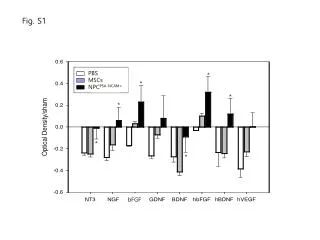
Analysis of Experimental Results in Figures S1, S2, and S3: A Comprehensive Overview
DESCRIPTION
This document presents a detailed analysis of the results depicted in Figures S1, S2, and S3. Each figure comprises multiple panels (A, B, C, D for S1 and S2, and E, A, C, D, B for S3) showcasing various experimental data. The analysis focuses on the trends and significant findings illustrated within each section, providing insight into the underlying processes and implications of the results. This comprehensive overview aims to enhance understanding of the experimental outcomes and facilitate further research.
Download

1 / 3
Download Presentation

Télécharger la présentation
Analysis of Experimental Results in Figures S1, S2, and S3: A Comprehensive Overview
An Image/Link below is provided (as is) to download presentation
Download Policy: Content on the Website is provided to you AS IS for your information and personal use and may not be sold / licensed / shared on other websites without getting consent from its author.
Content is provided to you AS IS for your information and personal use only.
Download presentation by click this link.
While downloading, if for some reason you are not able to download a presentation, the publisher may have deleted the file from their server.
During download, if you can't get a presentation, the file might be deleted by the publisher.
E N D


![[Fig. S1]](https://cdn3.slideserve.com/6448662/slide1-dt.jpg)


More Related
Audio
Live Player