Bayesian Inference and Mitochondrial Genome Representation of Lepus Timidus
This study presents a rooted phylogeny of 11 hare specimens, with Oryctolagus cuniculus as an outgroup, based on 13 protein-coding mitochondrial (mtDNA) sequences, using Bayesian inference methods. Posterior probabilities are indicated at the nodes, enhancing the phylogenetic assessment. Additionally, we provide a circular representation of the Lepus timidus mitogenome, illustrating gene transcription from the H- and L-strands. Protein-coding genes, ribosomal genes, and transfer RNAs are visually distinguished by color. Insights into the replication origins and potential pseudogenes are also discussed.


Bayesian Inference and Mitochondrial Genome Representation of Lepus Timidus
E N D
Presentation Transcript
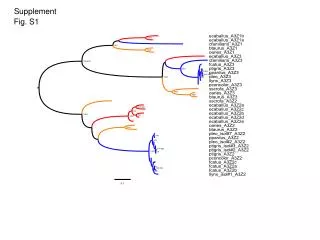
Fig. S1: Fig. S1.Rooted phylogeny (Oryctolagus cuniculus used as outgroup; GenBank Acc. Nr. NC_001913) of 11 hare specimens (codes in parenthesis correspond to those indicated in Table 1) based on 13 protein coding mtDNA sequences, estimated using Bayesian inference. Posterior probabilities are shown next to the nodes.
Fig. S2: Fig. S2. Circular representation of Lepus timidus mitogenome. Genes located outside in the external circle (H-strand) have their RNA transcribed from the H-strand, whereas genes located inside in the external circle (L-strand) are transcribed using the L-strand. Protein-coding genes are colored in green, ribosomal genes in brown, transfer RNAs in orange and the control-region in red. Abbreviations: 12S and 16S rRNAs, ribosomal RNAs 12S and 16S; ND1 to ND6, subunits 1–6 of NADH dehydrogenase; CYTB, cytochrome b; COX1, COX2 and COX3, subunits of cytochrome c oxidase; ATP6 and ATP8, subunits of ATP synthetase. tRNA genes are indicated by a one-letter code of the corresponding amino acid. OriH and OriL represent replication origins for the H- and L-strand, respectively. Repeated regions and OriL are shown in the inner circle and colored in black and red, respectively. Within the D-loop region a predicted putative pseudo-tRNA is highlighted in black.


![[Fig. S1]](https://cdn3.slideserve.com/6448662/slide1-dt.jpg)