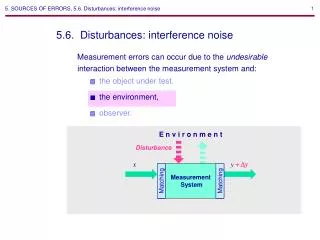
Sources of Errors
Sources of Errors. M&E Capacity Strengthening Workshop, Addis Ababa 4 to 8 June 2012 Arif Rashid, TOPS. Type of Data. Routine Monitoring Data (Output and Process). Annual Monitoring/ Evaluation Survey Data. Slide # 1. Routine Monitoring Data. M&E Officer. Technicians.

Sources of Errors
E N D
Presentation Transcript
Sources of Errors M&E Capacity Strengthening Workshop, Addis Ababa 4 to 8 June 2012 Arif Rashid, TOPS
Type of Data Routine Monitoring Data (Output and Process) Annual Monitoring/ Evaluation Survey Data Slide # 1
Routine Monitoring Data M&E Officer Technicians Field Office Country Office Slide # 2
Source of Errors What could be the source of errors? • Reporting • Recording • Aggregation • Manipulation It is important to keep all source documents Slide #3
Survey Data: Sources of Errors Sampling Error Non Sampling Error Slide # 4
Sampling Error Age: 29.7 • Standard Error or Margin of Error – Idea of precision of statistical estimate Slide # 5
Sampling Error Population mean age: 29.7 Age: 30.2 Age: 29.5 Age: 28.8 Slide # 6
Sampling Error • Standard error • A small standard error means that the sample statistic is closer to the population parameter. • The larger the sample size, the smaller the standard error. Slide # 7
Non Sampling Error • Specification Error: Concept implied by the question is different from the underlying construct to be measured • Example: How many children do you have – interpretation could be different based on the culture Slide # 8
Non Sampling Error • Sampling frame Error: Households can be omitted or appear in two “enumeration areas” (EA) if the EAs are not properly demarcated. • Example: If not done carefully, households/ primary sampling units can easily be omitted from clusters or enumeration areas. More common in multi-stage cluster surveys. Slide # 9
Non Sampling Error • Non-response: Failure to measure some of the sample units. • Example: Respondent not-at-home, refuse to answer certain questions, or refuse to answer to the survey. Slide # 10
Non Sampling Error • Measurement Error: What is observed or measured is different than the actual values of sample units. • Example: Incorrect age, or weight or height. Slide # 11
Non Sampling Error • Processing Error: • Editing errors. • Coding errors. • Data entry errors. • Programming errors etc. • Example: Use of wrong codes, inconsistent values, incorrect computation of variables. Slide # 12
This presentation was made possible by the generous support of the American people through the United States Agency for International Development (USAID). The contents are the responsibility of Save the Children and do not necessarily reflect the views of USAID or the United States Government.