Download

1 / 19
190 likes | 342 Vues
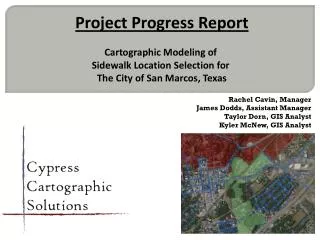
Cartographic Modeling of Sidewalk Location Selection for The City of San Marcos, Texas. Rachel Cavin , Manager James Dodds , Assistant Manager Taylor Dorn, GIS Analyst Kyler McNew , GIS Analyst. Introduction. San Marcos, Texas is a diverse and growing community.

E N D
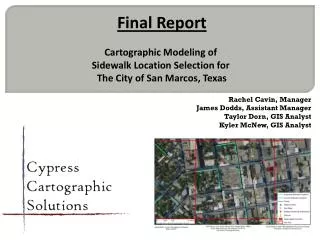
Cartographic Modeling of Sidewalk Location Selection for The City of San Marcos, Texas Rachel Cavin, Manager James Dodds, Assistant Manager Taylor Dorn, GIS Analyst KylerMcNew, GIS Analyst
Introduction San Marcos, Texas is a diverse and growing community. The city boasts numerous landmarks, including the river, outlet malls, and university. Providing adequate access for all members of the community represents a challenge.
Introduction Residents have expressed desire for improved pedestrian infrastructure. Currently, no formal system for siting sidewalks exists. To effectively meet citizen needs, a process for determining potential sidewalk locations is to be developed.
Objectives Develop a model that hierarchically ranks potential locations for sidewalks based on criteria that are determined to generate pedestrian traffic. Locate areas that are in need of sidewalks within the San Marcos City Limits. Ensure this model can be used for future projects.
Data Projection: Lambert Conformal Conic
Data Projection: Lambert Conformal Conic
Data Limits • Data may not be current. • Data is not survey grade. • Google Maps and Earth may not be accurate. • Errors may be present.
Methodology Data Preparation • Create necessary data layers for additional traffic generators. • Create a layer that shows gaps in the sidewalk inventory by placing center points in the gaps of the present sidewalk inventory.
Methodology Data Processing • Begin model development by editing data to fit our scope. • Finalize factor ratings and weights for each criteria. • Use buffers to associate gap center points with the factors. • Transform associated data layers into raster format for analysis.
Methodology All ratings and weights are tentative.
Methodology Data Analysis • Continue model development, input all factor ratings and weights. • Run all the factors through a weighted sum function, this will calculate location scores. • We will also run average factors through a weighted sum function to compare outcome. • Locations with the highest scores will have the greatest need for access to pedestrian traffic generators.
Methodology Model Certainty Check • To assess our model’s sensitivity, we will run it multiple times, each using different buffer radius lengths. • Buffers with 50, 100, and 200 meter radius lengths. • Adjustments will be made to the model to correct any uncertainty.
Research/Results/Findings Quantitative ranking systems are common in sidewalk locating (Pérez 2010, Zipf2010) It is difficult to determine how sidewalks should be sited, as access needs are hard to quantify. The relative importance of factors to be ranked is always subjective, but tailoring the ranking to the local needs is crucial.
Research/Results/Findings Result of our project will be a model the City of San Marcos can use to plan potential sidewalk development. Our model will not be suitable for the actual locating of sidewalks, only as a conceptual guide to scout sites for surveying.
Final Deliverables • At the conclusion of our project, The City of San Marcos will receive the following: • Detailed Final Report (two copies) • Project Website • CD, two copies containing: • All data • Metadata • Proposal, Progress Report, and Final Report • Poster • PowerPoint Presentations • Instructions on how to use the CD (readmefile) • A poster will be produced for the Texas State Geography Department.
Timetable Key Dates February 20th- Proposal Presentation March 25th - Progress Presentation May 3rd – Final Product Delivered • Phase 1: Data Collection • February 5th - February 20th • Reviewing available literature & collecting data • Phase 2: Data Processing • February 21st - March 25th • Data will be converted into proper format • Metadata will be checked to ensure accuracy • Phase 3: Data Analysis • March 26th - April 25th • Criteria ranking & weights will be integrated into our model • Phase 4: Data Interpretation • April 26th – May 3rd • Develop visualizations for results
Conclusion Our project will develop a model to rank sidewalk development locations based on criteria such as schools and medical facilities. We will produce maps using our model results that will illustrate locations within the San Marcos city limits in need of sidewalks. Our model concept is based on research done by others, as well as GIS suitability modeling.
Conclusion Our hope is that our project will provide a valuable resource for the City of San Marcos as pedestrian infrastructure developments are planned. Allocating funds to the areas most in need of development is critical. We will endeavor to create as accurate and sensitive a model as possible.
Any Questions? Thank you.