Download
1 / 17
170 likes | 353 Vues
Final Report Cartographic Modeling of Sidewalk Location Selection for The City of San Marcos, Texas. Rachel Cavin , Manager James Dodds , Assistant Manager Taylor Dorn, GIS Analyst Kyler McNew , GIS Analyst. Project Description.

E N D
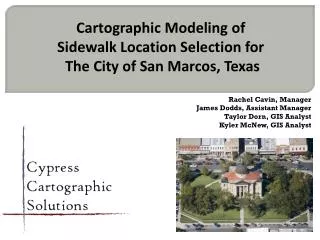
Final Report Cartographic Modeling of Sidewalk Location Selection for The City of San Marcos, Texas Rachel Cavin, Manager James Dodds, Assistant Manager Taylor Dorn, GIS Analyst KylerMcNew, GIS Analyst
Project Description Our purpose is to develop a GIS model to select locations in need of pedestrian infrastructure improvements within San Marcos, Texas. The selection process is based on location of pedestrian traffic generators throughout San Marcos, such as schools, retail centers, and parks. Additionally, a sidewalk length to street length ratio was calculated for every cell to reveal locations most deficient in pedestrian infrastructure.
Data City facilities, schools, parks and trails, Texas State University, street centerlines, and a current sidewalk inventory were provided by the City of San Marcos. Bobcat Tram and CARTS pickup points, medical and pharmaceutical facilities, retail centers, low-income housing, and trailhead layers were created by our team. Aerial photography of San Marcos was acquired from TNRIS.
Methodology Divided city limits into ¼ square mile grid cells. Scored each grid cell by pedestrian traffic generators contained. Calculated sidewalk length to road length ratio. Compared highest scored cells to aerial imagery. Selected areas in need of sidewalks.
Results Resulting from our model was a system to rank focus areas within which sites can be selected for sidewalk development. We found that high scoring grid cells were clustered in three parts of town(seen in next graphic). We located gaps within the sidewalk inventory that were near identified traffic generators.
Problems • Accurately representing city needs in ranking our factors. • Designing the model to calculate the sidewalk to road ratio. • Time • Within the scope and time constraints of this project it is not feasible to identify all areas of missing sidewalks throughout the city. However, in future analysis this would provide the most accurate analysis for exact locations to be improved. • We have overcome all issues that have presented themselves
Limitations • Grid cell locations influence results. • Data isn’t all comprehensive and temporally current. • Point layers such as “Retail Centers” do not contain all possible businesses throughout the city. • Aerial photograph is from 2008 • Accuracy of Google Earth • Points created and imported are not always in their true locations
Deliverables • Detailed Final Report (2 copies) • In depth record of our decision making process, analysis steps, and results. • Website • Company website that will contain team members’ backgrounds, copies of reports and presentations, and an interactive web-based GIS software package (Manifold) • Metadata (2 copies) • Detailed Metadata has been created to track the sources of information, give credit to authors of new data, track lineages and details of layers. • DVD (2 copies) • The city of San Marcos will be provided a DVD containing all data, metadata, all reports and presentations, and instructions on how to use the DVD(read-me file) • Poster for the Texas State University Geography Department and Client
Conclusion San Marcos is a diverse community and improved pedestrian infrastructure can benefit everyone. Our initial methodology was far too labor intensive for the scope of our project. Despite a few setbacks, our project was a success. The group benefited in many ways including strengthening our team work skills, learning the GIS implementation process, and understanding how to problem solve in GIS more effectively.
Acknowledgments Cypress Cartographic Solutions would like to thank Dr. Alberto Giordano, Ryan Schuermann, Kenny Skrobanek, and Joan Hickey for all of their help and support throughout this project.
Any Questions? Thank you.