Download
1 / 47
470 likes | 679 Vues
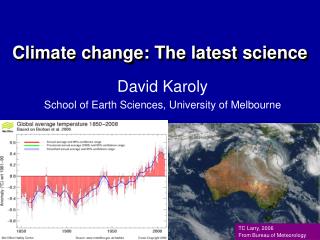
The latest on climate change in Hong Kong T C Lee HKCCF Programme on climate change 21 September 2010. CONTENT Background Observed changes Temperature Rainfall Sea Level Severe Weather Events Other Meteorological Elements 21st century projections Future research activities.

E N D
The latest on climate change in Hong Kong T C Lee HKCCF Programme on climate change 21 September 2010
CONTENT • Background • Observed changes • Temperature • Rainfall • Sea Level • Severe Weather Events • Other Meteorological Elements • 21st century projections • Future research activities
Climate Monitoring in Hong Kong Hong Kong Observatory Headquarters Regular meteorological observations commenced in 1884, including temperature, rainfall, pressure, sunshine duration (upto1960), wind speed/direction, etc. King’s Park Meteorological Station Daily radiosonde ascents began in 1951. One of the stations in the Global Climate Observing System (GCOS) Upper Air Network (GUAN). Other meteorological measurements since 1950s include pressure, temperature, rainfall, sunshine duration, evaporation, etc.
Kowloon KP HKO Lantau Island HK Island WGL Locations of Key Climatological Stations in Hong Kong
Urban snapshots in Hong Kong Dense development Many Skyscrapers 100 - 400m e.g. IFC ~ 415 m Central Plaza ~ 374m
Urbanization effect on wind speed, visibility and evaporation
Observed Climate Change in Hong Kong Climate change in HK = Global Warming + Local Urbanization Effect
Temperature trend in Hong Kong Annual mean temperature recorded at the Hong Kong Observatory Headquarters (1885-2009). Data are not available from 1940 to 1946
Annual mean surface air temperature for 1951-2007 in Hongkong (red) and Guangzhou (green) as well as Macao (blue) (Source : 冯瑞权 吴池胜 王安宇 何夏江 王婷 梁嘉静 黎婉文 梁必骐, 1901—2007年澳门地面气温变化的分析, 《气候变化研究进展》 2009年01期)
Changes in average temperatures in Guangdong 1975-1980 2001-2006 (Source : 广东气候变化评估报告(节选), 广东省气候变化评估报告编制课题组,广东气象, Vol. 29 (3), 2007.)
Annual Number of Hot Night in Hong Kong (1885-2009)(Daily Min. Temp>= 28oC)
Annual number of cold days in Hong Kong (1885-2009) (Daily Min. Temp<= 12oC)
Annual number of very hot days in Hong Kong (1885-2009) (Daily Max. Temp>=33oC)
Time dependent return period analysis of extreme temperature events in Hong Kong (Source : Wong, M.C. and H.Y. Mok, 2009: Trends in Hong Kong Climate Parameters Relevant to Engineering Design. HKIE Civil Division Conference 2009 : Conference on Engineers' Responses to Climate Change.)
Rainfall trend in Hong Kong Annual rainfall recorded at the Hong Kong Observatory Headquarters (1885-2009).Data are not available from 1940 to 1946
Number of rain days in Hong Kong (daily rainfall >=1 mm) (at HKO Headquarters)
Number of heavy rain days (hourly rainfall > 30 mm) at Hong Kong Observatory Headquarters (1885 – 2009) i.e. +3 days in a century
Record high hourly rainfall at the Hong Kong Observatory Headquarters (1885 – 2009)
Extremes becomingmore frequent Changes in frequency of extreme rainfall events based on time-dependent return period analysis
Long term trend of annual total rainfall due to heavy rainfall events (R95p) R95p : annual total rainfall at HKO Headquarters due to events exceeding the daily 95th percentile of the climatological normal (1971-2000)
Sea Level Rise in Hong Kong Sea level rise in Hong Kong On average, the mean sea level in the Victoria Harbour has risen at a rate of 2.6 mm per year during the period 1954 to 2009
Causes of Sea-level Change Image source: Causes of sea level rise from climate change. (2002). In UNEP/GRID-Arendal Maps and Graphics Library. Retrieved March 11, 2010 from http://maps.grida.no/go/graphic/causes-of-sea-level-rise-from-climate-change.
Number of Thunderstorm Days from 1947 to 2009 (as observed at HKO Headquarters)
Annual number of tropical cyclones making landfall along the south China coast within 300 km of Hong Kong from 1961 to 2009
Annual number of typhoon making landfall along the south China coast within 300 km of Hong Kong from 1961 to 2009
Annual mean daily solar radiation recorded at King’s Park Station (1958-2009)
Annual average of 12-hr 10 minute mean wind speed at King’s Park and Waglan Island (1968-2008)
Annual total number of hours with visibility at HKO Headquarters below 8km from 1968-2008 (relative humidity below 95% and not counting rain, mist or fog)
Projections for Hong Kong in the 21st century • Temperature : the increasing trend will continue. The mean temperature in the decade 2090-2099 is expected to rise by 4 to 5oC relative to the period 1980-1999. • Rainfall : will increase during the latter half of the 21st century with about 10% increase relative to the 1980-1999 average. • Sea level : The sea-level at the South China Sea including Hong Kong is likely to be close to the global average in the long run. • According to IPCC AR4, the global average sea-level will rise by 0.18 to 0.59 m at the end of 21st century relative to the period 1980 to 1999. • Recent studies by some research groups suggest higher projections Uncertainties : there are still large uncertainties in the model simulation for the future climate, depending very much on the future forcing emission scenarios and local urbanization effect as well as the model characteristics/performance.
Magnitude of Extreme Sea-levels A sea-level of 3.5 mCD similar to that during Typhoon Hagupit, a once in 50 years event, would become a bienniel event after a rise of the mean sea-level by 0.59 m. Note: mCD = metres above Chart Datum. Chart Datum is 0.146 metre below Principal Datum.
Future Work on Climate Research • Future trends of extreme temperature and rainfall events based on IPCC AR4 (daily model data) • Update projections of Hong Kong climate in the 21st Century base on IPCC AR5 model data • Urbanization effects on Hong Kong climate • Weather and Health (Rotavirus, RSV, etc.) – collaboration with CUHK • Climate and Ecosystem / Other social impacts
Summary • Significant changes in the climate in Hong Kong were observed in the last century, including the increase in average temperatures and total rainfall as well as the rise of mean sea level. • Studies of past occurrences of extreme temperature and rainfall in Hong Kong revealed that cold episodes have becomerarer while very hot days and heavy rain events are becoming more frequent • Looking into the future, Hong Kong can expect even warmer weather, more variable rainfall, and a sea level that keeps rising. • Climate change research is an on-going process.
Storm Surge + Sea-level Rise Waves caused by Typhoon Coast Coast Raised mean sea level Original mean sea level After sea-level rise, storm surges will bring more frequent sea flooding to coastal low-lying areas.
What would happen in past storms? Note: mCD = metres above Chart Datum. Chart Datum is 0.146 metre below Principal Datum.
Possible inundation around the Pearl River Delta caused by a sea level rise sea level rise of 0m sea level rise of 1m (Source : Wong, K.M., K.H. Lau, J.P. Gray. (2007), Impact of sea level rise on Hong Kong and the Pearl River Delta, presented in International Conference on Climate Change, May 2007, Hong Kong.)
Variation in electricity consumption in Hong Kongincreases significantly in the last 4 decadesin both domestic and commercial sectors. Year 1970-2009 Time Series of Seasonal Variation
A. Domestic Sector During warm months (May-Oct) – Electricity Consumption vs CDD 2000’s 1990’s 1980’s 1970’s Correlation is significant at 5% in all 4 decades. Sensitivity of electricity use to climate factor increases in recent decades.
Past and projected annual mean temperature anomaly for Hong Kong (based on IPCC AR4 annual mean projection data)