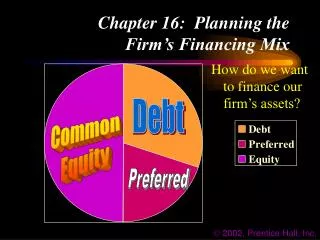
Planning the Financing Mix
Planning the Financing Mix. Capital Structure and Firm Value Capital Structure Theories Independence Hypothesis Dependence Hypothesis Moderate Position EBIT-EPS Analysis. Financial Structure. Balance Sheet Current Current Assets Liabilities

Planning the Financing Mix
E N D
Presentation Transcript
Planning the Financing Mix • Capital Structure and Firm Value • Capital Structure Theories • Independence Hypothesis • Dependence Hypothesis • Moderate Position • EBIT-EPS Analysis
Financial Structure Balance Sheet Current Current Assets Liabilities Debt and Fixed Preferred Assets Shareholders’ Equity Financial Structure
Capital Structure Balance Sheet Current Current Assets Liabilities Debt and Fixed Preferred Assets Shareholders’ Equity Capital Structure
Why is Capital Structure Important? • Leverage: Higher financial leverage means higher returns to stockholders, but higher risk due to interest payments • Cost of Capital: Each source of financing has a different cost. Capital structure affects the cost of capital • The Optimal Capital Structure is the one that minimizes the firm’s cost of capital and maximizes firm value
Independence Hypothesis • In a “perfect world” environment with no taxes, no transaction costs and perfectly efficient financial markets, capital structure does not matter • This is known as the Independence hypothesis: firm value is independent of capital structure • Firm value does not depend on capital structure • This is also to say WACC or ko is constant
Cost of Capital kcs kd kd 0% debt financial leverage 100% debt Independence Hypothesis (Continued) kcs = cost of common stock kd = cost of debt ko = cost of capital
Increasing leverage causes the cost of equity to rise. Equity becomes riskier kcs Cost of Capital What will be the net effect on the overall cost of capital? kcs kd kd 0% debt financial leverage 100% debt Independence Hypothesis
kcs Cost of Capital ko kd 0% debt financial leverage 100%debt Independence Hypothesis Cost of capital stays constant. Increase in cost of equity is proportionate to increase in debt kcs kd
Independence Hypothesis • If we have perfect capital markets, capital structure is irrelevant • In other words, changes in capital structure do not affect firm value
Dependence Hypothesis • Increasing leverage does not increase the cost of equity • Since debt is less expensive than equity, more debt financing would provide a lower cost of capital • A lower cost of capital would increase firm value
Cost of Capital kcs kcs ko kd kd financial leverage Dependence Hypothesis Since the cost of debt is lower than the cost of equity… Increasing leverage reduces the cost of capital.
Moderate Position • The previous hypotheses examines capital structure in a “perfect market” • The moderate position examines capital structure under more realistic conditions • For example, what happens if we include corporate taxes?
Remember this example?Tax effects of financing with debt with stockwith debt EBIT 400,000 400,000 - interest expense 0(50,000) EBT 400,000 350,000 - taxes (34%) (136,000)(119,000) EAT 264,000 231,000 - dividends (50,000) 0 Retained earnings 214,000 231,000
Even if the cost of equity rises as leverage increases, the cost of debt is very low... kcs Cost of Capital Because of the tax benefit associated with debt financing kcs kd kd financial leverage Moderate Position
The low cost of debt reduces the cost of capital. kc Cost of Capital kc ko kd kd financial leverage Moderate Position
Moderate Position • So, what does the tax benefit of debt financing mean for the value of the firm? • The more debt financing used, the greater the tax benefit, and the greater the value of the firm • So, this would mean that all firms should be financed with 100% debt, right? • Why are firms not financed with 100% debt?
Why is 100% Debt not Optimal? • Bankruptcy costs: costs of financial distress • Financing becomes difficult to get • Customers leave due to uncertainty • Possible restructuring or liquidation costs if bankruptcy occurs
Why is 100% Debt not Optimal? • Agency costs: costs associated with protecting bondholders • Bondholders (principals) lend money to the firm and expect it to be invested wisely • Stockholders own the firm and elect the board and hire managers (agents) • Bond covenants require managers to be monitored. The monitoring expense is an agency cost, which increases as debt increases
kc Cost of Capital If a firm borrows too much, the costs of debt and equity will spike upward, due to bankruptcy costs and agency costs kc kd kd financial leverage Moderate Positionwith Bankruptcy and Agency Costs
kc Cost of Capital ko kc kd kd financial leverage Moderate Positionwith Bankruptcy and Agency Costs
kc Cost of Capital ko kc kd kd financial leverage Moderate Positionwith Bankruptcy and Agency Costs Ideally, a firm should use leverage to obtain their optimum capital structure, which will minimize the firm’s cost of capital
Capital Structure Management • EBIT-EPS Analysis – used to help determine whether it would be better to finance a project with debt or equity • I = interest expense, t = corporate tax rate • P = preferred dividends, • S = number of shares of common stock outstanding
EBIT-EPS Example • Our firm has 800,000 shares of common stock outstanding, no debt, and a marginal tax rate of 40%. We need $6,000,000 to finance a proposed project. We are considering two options: • Sell 200,000 shares of common stock at $30 per share • Borrow $6,000,000 by issuing 10% bonds
If we expect EBIT to be $2,000,000: Financing stock debt EBIT 2,000,000 2,000,000 - interest 0(600,000) EBT 2,000,000 1,400,000 - taxes (40%) (800,000)(560,000) EAT 1,200,000840,000 # shares outstanding 1,000,000 800,000 EPS $1.20 $1.05
If we expect EBIT to be $4,000,000: Financing stock debt EBIT 4,000,000 4,000,000 - interest 0(600,000) EBT 4,000,000 3,400,000 - taxes (40%) (1,600,000)(1,360,000) EAT 2,400,000 2,040,000 # shares outstanding 1,000,000 800,000 EPS $2.40 $2.55
EBIT-EPS Example • If EBIT is $2,000,000, commonstockfinancing is best • If EBIT is $4,000,000, debt financing is best • So, now we need to find a crossoverEBIT where neither is better than the other
Crossover EBIT (Continued) • Set 2 EPS calculations equal to each other and solve for EBIT: Stock FinancingDebt Financing (EBIT – I)(1 – t) – P = (EBIT – I)(1 – t) – P S S
Crossover EBIT (Continued) Stock FinancingDebt Financing (EBIT – I)(1 – t ) – P = (EBIT – I )(1 – t ) – P S S (EBIT – 0) (1 – 0.40) = (EBIT – 600,000)(1 – 0.40) 800,000 + 200,000 800,000 0.6 EBIT = 0.6 EBIT – 360,000 1 0.8 0.48 EBIT = 0.6 EBIT – 360,000 0.12 EBIT = 360,000 EBIT = $3,000,000