The Hadley Centre
The Hadley Centre. The forcing of sea ice characteristics by the NAO in HadGEM1 UK Sea Ice Workshop, 9 September 2005 Chris Durman 1,2 and Jonathan Bamber 2 1. Hadley Centre for Climate Prediction and Research, Met Office 2. Bristol Glaciology Centre, School of Geographical Sciences,

The Hadley Centre
E N D
Presentation Transcript
The Hadley Centre The forcing of sea ice characteristics by the NAO in HadGEM1 UK Sea Ice Workshop, 9 September 2005 Chris Durman1,2 and Jonathan Bamber2 1. Hadley Centre for Climate Prediction and Research, Met Office 2. Bristol Glaciology Centre, School of Geographical Sciences, University of Bristol With thanks to: Tim Johns, Ann Keen, Alison McLaren and Jeff Ridley.
The Hadley Centre Talk Outline • Introduction • Simulated NAO and climate response in comparison • with observations • 3. Mechanisms of ice response: • Beaufort Sea / East Arctic Basin • Labrador Sea • 4. Conclusions
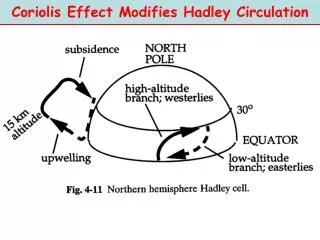
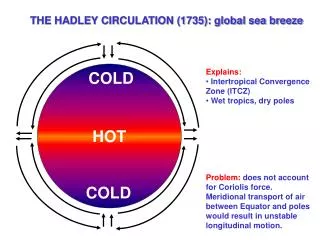
The Hadley Centre • NAO dominant mode of atmospheric variability in the North Atlantic region (Hurrell, 1995). • “See-saw” of intensification and weakening in PMSL between Azores High and Icelandic Low centres of action. • NAO “high +ve state” when pressure gradient is at a maximum. • Over the Arctic, modified circulation patterns result in perturbed geostrophic wind forcing → drives surface temperature changes. • Correlation between geostrophic winds and ice motion can be as high as 0.8 in the central Arctic (e.g. Thomas, 1999). • Perturbed surface temperatures influence the rate at which ice grows / melts thermodynamically. The NAO and Arctic Sea Ice
The Hadley Centre Experimental setup and data • HadGEM1 IPCC AR4 Control run: • Fixed 1860 forcing levels for greenhouse gases, ozone, sulphur, other • precursor emissions and land surface conditions. • Spinup integration of 85 years in length was carried out from which the control • run was initialised. • Spinup ocean state initialised from September climatology of Levitus. • Spinup Northern Hemisphere sea ice volume initialised from HadISST. • Data: • First 300 years of control run analysed here.
The Hadley Centre DJF PMSL
The Hadley Centre DJF PMSL
The Hadley Centre Leading order EOFs of DJF PMSL Variance: 44.8% Variance: 41.1%
The Hadley Centre HadGEM1 NAO Index Index: Difference in PMSL between Azores and Iceland. Normalisation: subtract mean and divide by standard deviation. Define “High NAO Years” as those where normalised Index exceeds unity. 300 year control run yields 48 High NAO Years.
The Hadley Centre HadGEM1 DJF PMSL
The Hadley Centre DJF Surface Temperature Anomaly DJF Ice Concentration Anomaly
The Hadley Centre HadGEM1 DJF Ice Property Anomalies
The Hadley Centre HadGEM1 DJF ice velocity
The Hadley Centre HadGEM1 DJF Wind Velocity
The Hadley Centre JJA Ice Response Concentration Thickness
The Hadley Centre Ice volume flux (m3 per season) through longitude 180oW averaged between 70oN and 80oN
The Hadley Centre DJF Labrador Sea Ice Anomalies
The Hadley Centre DJF Labrador Sea Anomalies
The Hadley Centre Implied DJF ice thickness response in the Labrador Sea Average increase in rate of change of ice thickness due to thermodynamic processes = +2.07x10⁻⁸ ms-1. => anomalous thickness of 0.16m compared with model climatology. But average thickness anomaly = 0.086m. Thermodynamics not the whole story?
The Hadley Centre DJF ice thermodynamics and velocity
The Hadley Centre HadGEM1 DJF PMSL
The Hadley Centre Conclusions • HadGEM1 realistically simulates the NAO dipole pressure pattern. • Simulated HadGEM1 surface temperature and Arctic sea ice concentration • anomaly patterns associated with the NAO are consistent with observations. • The response of Arctic basin sea ice to high NAO events is a dipole with increased ice in the western Arctic and reduced ice in the east. This pattern is formed as a result of reduced ice transport due to perturbed wind forcing. • Ice thickness anomalies in the Labrador Sea are largely initiated by thermodynamic processes but dynamic processes act to limit the anomalies.
The Hadley Centre Extra slides
The Hadley Centre Fram Strait ice export response
The Hadley Centre Fram Strait export response? (Zhang et al., 2000, J. Climate)
The Hadley Centre HadGEM1 normalised NAO index vs average Fram Strait ice export Corr = 0.03
The Hadley Centre HadGEM1 DJF Wind Velocity
The Hadley Centre Running 7-year means of simulated normalised NAO index
The Hadley Centre (Ringer et al., 2005, J. Climate)