Download
1 / 26
260 likes | 390 Vues
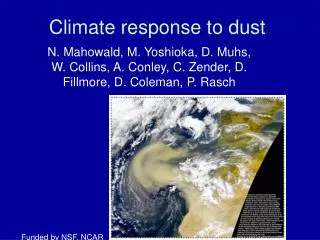
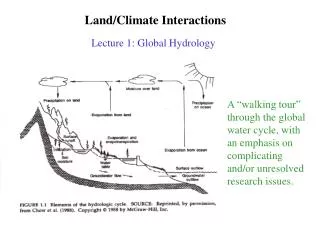
Dust-Climate Interactions in HadGEM2 Stephanie Woodward Met Office Hadley Centre (stephanie.woodward@metoffice.gov.uk) . A dust scheme for climate modelling needs to - work globally (including areas not currently sources) - respond to changing climate and so must

E N D
Dust-Climate Interactions in HadGEM2 Stephanie Woodward Met Office Hadley Centre (stephanie.woodward@metoffice.gov.uk)
A dust scheme for climate modelling needs to - work globally (including areas not currently sources) - respond to changing climate and so must - work from model-generated fields - be physically realistic .
Outline of HadGEM dust scheme 6 size bins of aerosol.03 – 30 um radius, treated independantly Interactive emission scheme Transport as 6 model tracers Dry deposition through gravitational settling and turbulent mixing in BL Wet deposition, scavenging coefficients from obs Resistance analogue method of combining deposition processes Radiative properties from medians of range of measurements * Volken & Schumann 1993, Water, Air & Soil Pollution 68
Emission scheme Soil: 9 size bins .06-2000um diameter Horizontal flux : Marticorena & Bergametti (bare soil fraction only) U* corrected for scaling effects U*t = U*t (dry,impact) x f (CorrectedSoilMoisture) f - Fecan scheme, modified at high soil moistures Vertical flux: only .06-60 um range total flux from log (F/G)=.134(%clay)-6 (M&B, based on Iversen data) size distribution from that of horiz. flux below 60um
Emissions • Deposition • Load (22Tg)
Comparison with concentrations at U Miami stations CGr KGI Maw Pal Fun Nau Nor ASm Mid Ohu Chu Fan EwtBar Ber MaH Mia Iza
Comparison with Aeronet AODs Cap Verde Solar village Sede Boker Banizoubou Ougadougou Ilorin
Dust & Climate Objective:To investigate feedbacks between climate and dust Model: proto-HadGEM2-AO GCM (N96 38 levs), including proto-dust scheme 2 Experiments: “A” – Active Dust – dust radiative effects included “P” – Passive Dust – dust radiative effects excluded Each experiment: 20 years spin up allows climate (including ocean) to come to equilibrium +10 years run
‘A’ concentrations & AODs vs. Observations Cape Grim (concs) Funafuti (concs) Midway (concs) Bermuda (concs) Cape Verde (AOD) Solar Village (AOD)
A A P P • P
Emissions increase of 50% over N Africa, due to positive feedback
Temperature differences ( A – P ) ~18km ~8km ~2km
Humidity • A • P • diff
Summary Dust scheme developed for HadGEM2 Good agreement with obs Feedbacks on Dust production: Positive in Sahara Negative in moister regime Shifts in circulation patterns