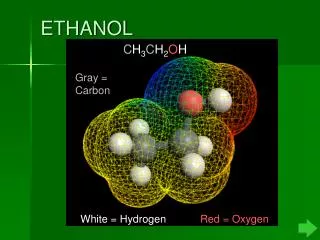
Ethanol
Ethanol. Solar Energy. Avg. 0.3 - Max 6.7% of Incident Sunlight Converted to Biomass 1. Photosynthesis. Crops. Biomass. Natural Vegetation (grass, foliage, timber). Energy crops. Ag and Urban Wastes. Corn/Cane. 20 - 40% 2,3,4. 33 - 54% 1. Ethanol. Bioethanol.

Ethanol
E N D
Presentation Transcript
SolarEnergy Avg. 0.3 - Max 6.7% of Incident Sunlight Converted to Biomass1 Photosynthesis Crops Biomass Natural Vegetation (grass, foliage, timber) Energy crops Ag and Urban Wastes Corn/Cane 20 - 40%2,3,4 33 - 54%1 Ethanol Bioethanol 1 - Kheshgi et al. 2000 2 - Cook et al. 1991 3 - Lynd et al. 1991 4 - Wooley et al. 1999
Cellulosic Sources • Bioethanol defined as being derived from cellulose/hemicellulose • Types of energy crops: • Hybrid Poplars • Cottonwoods • Willows • Switchgrass
Cellulose 43% Hemicellulose 27% Lignin 17% Other 13% Agricultural Residues Cellulose 45% Hemicellulose 30% Lignin 15% Other 10% Herbaceous Energy Crops Cellulosic Biomass Composition Cellulose 45% Hemicellulose 25% Lignin 22% Extractives 5% Ash 3% WoodyCrops Ash 15% Lignin 10% Hemicellulose 9% Other carbohydrates 9% Protein 3% Other 9% Cellulose 45% Municipal Solid Waste
DOE approach • Use of idle crop land (82 million acres) • 392 million acres are suitable for biomass • best land is in the north central region • Short-rotation woody crops expected annual yields of 5 or more dry tons per acre could be grown on 225 million acres (2423 million tons) • Herbaceous energy crops with similar yields could be grown on 324 million acres (1427 million tons) • It would take 82 million acres (6 dry tons/acre) to produce 492 million tons of dry biomass. This would yield to produce ~ 40 billion gallons of ethanol - enough to replace 22% of US gasoline consumption on an energy basis. • If you used all 392 million acres ~ 190 million gallons, slightly more than enough ethanol to replace gasoline consumption.
U.S. Crop Suitability Map Source: Oak Ridge National Laboratory
Gasoline requirements per region (% of Total - 1.2 billion gallons) 5% 15% 8% 3% 14% 16% 12% 27% £ 5% > 5 to £ 10% > 10 to £ 20% > 20% Do to rounding values may not equal 100%
Land Use in the Contiguous 48 States Proportion of Total Area (%) Acreage (Million Acres) Use Grassland Pasture & Range Forest Cropland Special Use Other Use 589 559 460 194 92 31 30 24 10 5
Ethanol Supply & Demand Data from Urbanchik, 2000
Ethanol/Gasoline Value Impact Property Energy density Heat of vaporization Lower flame temperature Relative volume of combustion products Octane Number 0.65-0.69 2.3 0.976 1.07 1.15 Lower mpg Larger tank More air to cylinder Increased power Decreased cooling needs Higher efficiency in optimized engine Increases work from gas expansion Allows increased compression ratio and hence higher Power and efficiency Ethanol fuel properties in relation to fuel performance From Lynd 1996;Bailey 1996
Corn Milling Liquefaction Saccharification Fermentation Corn Gluco-amylase a-Amylase Yeast Fuel Grade Ethanol Distillation Dehydration Denaturant Centrifugation Evaporation Distillers Dried Grains w/ soluble Dry Feed Mixing Cooling Drying Dry Milling Simplified Process
Wet Mill Dry Mill $/gal 0.45 0.34-0.45 0.26-0.49 1.05-1.40 0.37 0.31-0.47 0.20-0.44 0.90-1.33 Net Corn Costs Other Operating Costs Annualized Capital Costs Total Production Costs Current Ethanol Costs
How much land for corn ethanol? • 2.5 gallons of ethanol from a bushel of corn • US average corn yield per acre was 132 bushels for the period from 1997 to 1999 • Thus, a little under 3.9 million acres of corn is needed to meet the current ethanol demand • 9.6 million acres would be needed to meet the 2004 ethanol demand
Issues • The projected 2004 demand is essentially equivalent to the ethanol produced from cane sugar in Brazil (3.1 vs 3.4 billion gallons). • Infrastructure development - mainly dry mills • Co-products • Energy Balance
Energy Requirements • Units of Fossil Energy/Unit of Fuel Energy • Gasoline 1.29 • Diesel 1.19 • Corn ethanol 0.99 • Sources: Sheehan [1998], Riley [1995], Shapouri [1995]
Reasons to use Bioethanol • Energy security • Petroleum prices rise • CAFE Increase • Serious about greenhouse gas emissions
Simplified Bioethanol Process Detoxification Via Ion Exchange Dilute Acid Pretreatment Liquid Solid Separation Size Reduction Biomass Enzyme Production SSCF Fermentation Fuel Grade Ethanol Separation Solids Processing Cogen
Energy Requirements • Units of Fossil Energy/Unit of Fuel Energy • Gasoline 1.29 • Diesel 1.19 • Corn ethanol 0.99 • E95 (lignocell) 0.25 • Sources: Sheehan [1998], Riley [1995], Shapouri [1995]
Dry Mill Wet Mill Cellulosic $/gal Net Feedstock Costs Other Operating Costs Annualized Capital Costs Total Production Costs 0.45 0.34 0.26 1.05 0.37 0.31 0.22 0.90 0.37 0.25 0.54 1.16 Current Ethanol Costs
E85 Costs vs Gasoline Costs Volume Basis 2.0 1.5 $1.14 1.0 $0.94 0.5 2.0 Energy Basis $1.72 Gasoline Cost Blended Fuels Costs ($/gal) 1.5 $ 1.20/gal ethanol $1.42 1.0 $ 1.00/gal ethanol 0.5 2.0 Dedicated E85 Vehicle $1.53 1.5 1.0 $1.26 0.5 0.5 1.0 1.5 2.0 Gasoline Costs ($/gal)
Fuel Economics • Cellulosic ethanol currently costs too much • Gasoline $/gal $/liter Refinery gate price: 0.80 0.21 Transportation, storage, retailing: 0.40 0.11 Taxes: 0.30 0.08 Total (price at pump) 1.50 0.40 • Ethanol Production cost: 1.20 0.32 Assume distribution $/gal as above 0.40 0.11 Hold total tax revenue constant 0.20 0.05 Total 1.80 0.48 Total ($/volume gasoline equivalent) 2.70 0.71
Fuel/Vehicle Issues for Transition • E10: current gasoline ICE are able to use up to E10 • High level blends (up to E85): Flexible fueled ICE • 2 million current vehicles in U.S. • Requires vehicle modifications • Dedicated vehicles slightly more efficient • Start by all vehicles using E10 (50 billion liters for U.S., 10 X present production) • Manufacture flexible fueled vehicles, gradually shifting to dedicated vehicles as ethanol production increases
For lignocellulosic ethanol to penetrate transportation fuel market: • Technological advances & cost reductions • Infrastructure development • Higher petroleum prices • Stringent GHG emissions legislation • Subsidize production (via lower taxes) • Consumer demand for renewable fuels • Consumer acceptance of land use
Global Warming Potential for Alternative Fuel Vehicle Options Ethanol Options Lave 2000
Environmental Impact • food vs. energy • land use competition • soil quality • water quality • chemical inputs • biodiversity • monoculture • suitability for wildlife habitat • landscape effects • stability
Could the U.S. produce sufficient ethanol from energy crops to fuel its light-duty fleet? • To replace the 130 billion gallons (490 billion liters) of gasoline, would require 300-500 million acres (approx. ¼ of land area lower 48 states) • Investment in infrastructure (production facilities, distribution systems, retail stations) - $900 billion (over a decade) Does this make sense?