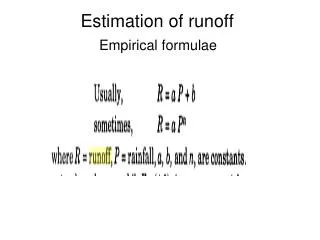

Runoff Factors and Equations in Hydrology
E N D
Presentation Transcript
Lecture Goals • Identify factors such as precipitation intensity, watershed slope, watershed roughness, cover, soil type, and pre-existing water content affecting runoff volume and peak flow conditions. • Understand runoff volume, peak flow, and hydrograph shape resulting from design or actual storms over compact watersheds drained by natural channels and constructed diversions.
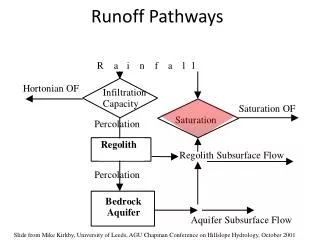
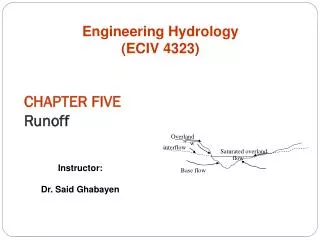
Runoff • Runoff generated by precipitation has three components: • Surface Runoff – water that flows over the soil surface. • Interflow – water that infiltrates and reemerges as a surface seep or ephemeral spring. • Subsurface or Groundwater Runoff – Runoff that originates from springs, seeps, and other areas where the water table intersects the land surface.
Runoff SURFACE RUNOFF SURFACE RUNOFF INFILTRATION INTERFLOW GROUNDWATER GROUNDWATER AQUICLUDE REGIONAL GROUNDWATER
Factors Affecting Runoff • Rainfall • Duration • Intensity • Areal Distribution • Watershed • Size • Shape • Orientation • Topography • Geology • Surface Culture
Runoff Water Balance • ET = evapotranspiration (cm/h) • f = infiltration rate (cm/h) • P = precipitation (cm) • Qi = interflow (cm) • Qg = groundwater runoff (cm) • Qs = surface runoff (cm) • qd = geological water loss (cm) • qg = groundwater recharge (cm) • Sd = surface detention (cm) • Si = interception (cm) • Sg = groundwater storage (cm) • Sr = surface retention (cm) • Ss = soil moisture storage (cm) • t = time interval (h) P ET Si Sr f Qs ground qg Qi Ss qd Sg Qg
Surface Runoff: Interflow: Groundwater flow: ET = evapotranspiration (cm/h) f = infiltration rate (cm/h) P = precipitation (cm) Qi = interflow (cm) Qg = groundwater runoff (cm) Qs = surface runoff (cm) qd = geological water loss (cm) qg = groundwater recharge (cm) Sd = surface detention (cm) Si = interception (cm) Sg = groundwater storage (cm) Sr = surface retention (cm) Ss = soil moisture storage (cm) t = time interval (h) Runoff Equations
Runoff Water Balance P ET Si Sr f Qs Qs = P – Si – Sr - ft ground qg Qi = (f-ET) t – Ss – qg Qi Ss qd Sg Qg Qg = qg – Sg - qd
Surface Runoff: Qs = P – Si – Sr - ft Interflow: Qi = (f-ET) t – Ss – qg Groundwater flow: Qg = qg – Sg - qd ET = evapotranspiration (cm/h) f = infiltration rate (cm/h) P = precipitation (cm) Qi = interflow (cm) Qg = groundwater runoff (cm) Qs = surface runoff (cm) qd = geological water loss (cm) qg = groundwater recharge (cm) Sd = surface detention (cm) Si = interception (cm) Sg = groundwater storage (cm) Sr = surface retention (cm) Ss = soil moisture storage (cm) t = time interval (h) Runoff Equations
Surface Runoff Interception INTERCEPTION SURFACE DETENTION SURFACE RUNOFF INFILTRATION
Interception • Rainfall stored on the ground surface (leaf surfaces, roof shingles…) and never reaches the soil surface. • Interception water is returned to the atmosphere via evaporation. • Interception is a function of the type and density of vegetation or surface cover, volume and intensity of precipitation, and wind speed. • Forest: up to 13 mm (0.5 inches) • Prairie: up to 7 mm (0.25 inches) • Corn: up to 0.5 mm • Typical assumption: 0.5 to 2.5 mm (up to 0.1 inches) • Interception both stores (retention) and detains (detention) rainfall. • Often estimate is based on vegetation type, subtract from rainfall.
Surface Retention (Depression Storage) • Rainfall stored on the ground surface (surface roughness, depressions, tire tracks,…) • Function of: management, time of year, land slope • Parking lot: not 0 mm, but close • Tilled soil: up to 25 mm • Typical assumption: 15 to 25 mm (up to 1 inch) • Water in retention storage either evaporates of infiltrates into the soil. • Surfaces both store (retention) and detain (detention) rainfall. • Estimate based on landuse type, subtract from rainfall.
Other Terms • Infiltration: movement of water into the soil (across soil surface boundary) • Horton’s equation • Green-Ampt Equation • Permeability hydraulic conductivity: movement of water through the soil • Use Darcy’s Law
Hydrograph • Hydrograph: represents flowrate (volume per unit time – water moving past a given point per time) vs. time • Area under hydrograph = cfs x sec = volume (ft3) • Can be used to verify runoff volume estimations
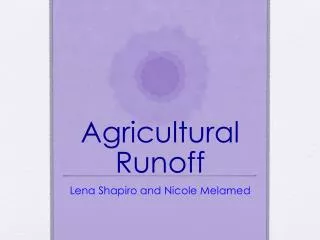
Hydrograph Properties • Hydrograph does not always start as soon as rainfall starts – Lag Time: time from center of mass of rainfall excess to peak runoff flow • Rising Limb or Concentration Curve: hydrograph increases as water from various points in the watershed “concentrate” at the outlet • Time to peak: time to maximum flow rate • Falling Limb or Recession Curve: storm has stopped • Falling limb always longer (slower) than rising limb • Total Runoff Volume: area under the hydrograph • Time of Concentration: time for water to flow from the farthest point in a watershed to the outlet.
Preurban lag time from peak of storm to peak of stream discharge Urban lag time from peak of storm to peak of stream discharge Urban streamflow Preurban streamflow Rainfall in inches per hour Runoff Comparison After Marsh, 1998
Runoff Calculations • Total volume of runoff • Ponds • Storage structures • Maximum rate of runoff • Culverts • Open channels • Conveyance systems