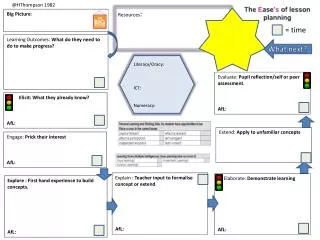
Big Picture
Big Picture. Continuous Improvement Aligned Improvement. Goals of the day. Data literacy Schoolwide Continuous Improvement Plan Crafting. Housekeeping. What’s in the basket? Norms Parking lot Big little. Multiple Measurement Rating Overview. Benefits of the Waiver from USED.

Big Picture
E N D
Presentation Transcript
Big Picture • Continuous Improvement • Aligned Improvement
Goals of the day • Data literacy • Schoolwide Continuous Improvement Plan Crafting
Housekeeping • What’s in the basket? • Norms • Parking lot • Big • little
Benefits of the Waiver from USED • Ability to implement a potentially more sensitive mechanism for federally mandated statewide accountability under ESEA – the Multiple Measurement Rating (MMR) • New statewide targets for AYP driven by actual performance rather than a linear, time-delineated goal driven by NCLB’s 2014 deadline • Elimination of prescriptive NCLB sanctions for all schools regardless of performance context • Elimination of many required set-asides tied to NCLB sanctions at the school and district level, including ineffective supplemental educational services • Differentiated improvement planning requirements for schools
Foundation for Statewide Accountability Remains the Same • Minnesota’s Academic Standards • Statewide Assessments in Reading, Mathematics, and Science – MCA-IIIs moving forward • Public reporting • Disaggregated data with an emphasis on achievement gaps • Adequate Yearly Progress determinations (with new differentiated targets
Minnesota’s Multiple Measurement Rating (MMR) • New accountability system emphasizes students growth and closing the achievement gap in addition to proficiency • Differentiates accountability for schools based upon performance across multiple domains included in MMR • Adds recognition of high performance • Returns primary responsibility for improvement efforts to districts • MDE will focus on the schools with the greatest needs and lowest performance
Recognition, Accountability and Support • MDE will assign Title I schools to three federally required accountability categories: • Reward Schools (Top 15% of Title I schools) • Priority Schools (Bottom 5% of Title I schools; three year designation) • Focus Schools (10% of Title I schools contributing most to state’s achievement gaps; three year designation) • MDE has also created two additional categories to recognize schools or promote improvement: • Celebration Schools (Title I schools between 60-85th percentile) • Continuous Improvement Schools (Title I schools in the bottom quartile not already identified as Focus or Priority Schools)
MMR’s Four Components • All Minnesota schools will receive an annual Multiple Measures Rating (MMR) comprised of up to four components: • Proficiency • Student Growth • Achievement Gap Closure • Graduation Rate (for schools with graduating classes) • Accountability designations only apply to schools receiving federal Title I aid under NCLB (ESEA) Schools are ranked in each domain by grade level cluster
Total MMR • Each domain is worth 25 points. • The MMR is generated by dividing the total number of points earned by the total number of points possible. • For most elementary and middle schools, 75 points possible. For most high schools 100 points possible. • The total MMR is a 0-100 percentage for all schools reflecting the proportion of points.
Focus Rating • In addition to an MMR, every school gets a Focus Rating to identify Focus Schools. • The Focus Rating measures proficiency and growth of students of color and students receiving special services (EL, Special Ed, Free and Reduced Price Lunch) • Focus Rating combines Achievement Gap Reduction and Focused Proficiency • Each domain is worth 25 points, for 50 possible points
Proficiency • Proficiency domain uses AYP index model. • Schools earn points based on a weighted percentage of subgroups making AYP. • Weighting is based on the size of subgroups. • Unlike in AYP calculation, in MMR Proficiency, groups can’t make AYP through Safe Harbor.
Growth • Growth measures ability of schools to get students to exceed predicted growth. • Growth predictions based on students’ last assessment result. • Predictions generated by looking at two cohorts of students, where they scored one year and where they scored the next year. • Student growth score based on being above or below prediction at each score point. • School growth score is average of student growth scores.
Achievement Gap Reduction • Measures the ability of schools to get higher levels of growth from lower-performing subgroups than statewide average growth for higher-performing subgroups. • Growth of individual subgroups of students of color compared to growth of white students, Els compared to non-Els, FRPs compared to non-FRPs, SPED compared to non-SPED. • Subtract schools’ growth scores for lower-performing groups from statewide averages of higher-performing groups. • Negative score indicates success.
Graduation Rate • Uses same methodology as Proficiency domain. • Looks at the percentage of subgroups that made AYP in graduation rate. • Current AYP grad rate targets are 85%. • Targets are changing next year. • Groups can only get credit for meeting the target, not through year-to-year improvements.
Focused Proficiency • Like Proficiency Domain, Focused Proficiency uses AYP index model. • Schools earn points based on a weighted percentage of subgroups making AYP – but excludes the All Students subgroup and the White subgroup. • Weighting is based on the size of subgroups.
Exit Criteria • Priority Schools: Two consecutive years out of the bottom 25 percent on the MMR (‘13 & ‘14). • Focus Schools: Two consecutive years out of the bottom 25 percent on the FR (‘13 & ‘14). • SIG Schools: Opportunity to exit at end of grant (‘13) if out of bottom 25 percent on MMR that year. • Priority or Focus: Immediate exit if a Reward School after any year starting in ‘13.
2011 25th Percentile • Elementary Schools: MMR 33.81%; FR 42.55%; Lowest Reward MMR 73.30% • Middle Schools: MMR 18.68%; FR 42.96%; Lowest Reward MMR 79.05% • High Schools: MMR 22.05%; FR 31.99%; Lowest Reward MMR 76.15% • Numbers will be different every year.
Annual MMR and FR • MDE must run AYP results based upon the newly approved targets – Target Date July 18, 2012 • Test results will come out August 1, 2012 • MMR and FR results – August 27, 2012 • Media release – August 29, 2012 • MMR and FR Public Release – August 30, 2012
SCIP and MMR/FR identifications • SPPS has received permission to use the SCIP in lieu of the state’s improvement plan format • Emphasis on a “proficient” SCIP allows us to ensure a level of quality to the plan • Continuous improvement schools will also face the same • Duration, intensity, frequency are key criteria for supporting Focus Schools
Next Steps • Plans will be submitted to MDE no later than September 1, 2012 • Some form of parental communication has to be sent but MDE has not yet indicated the “WHAT” • The 20% Title I set-aside has to be addressed in the Title I section of your SCIP • Expected alignment between goals, budget, and action plan
Stars in the Elevator Protocol for Minnesota’s new Multiple Measurement Rating (MMR) and Focus Rating (FR) RashmiVashisht, Data Coach, School & Program Improvement Joe Munnich, Policy, Planning and Intergovernmental Relations
Objectives • I can name the 3-4 components of MMR • Proficiency • Gap reduction • Growth • Graduation rate (HS only) • I can name the 2 components of FR • Focus proficiency • Gap reduction • I can report my school’s position relative to other schools in the state based on the state’s Multiple Measurement Rating (MMR) and Focus Rating (FR)
Your Data: MMR/FR Score Sheets BLUE GREEN PURPLE RED YELLOW PURPLE
RAFT • R – Role: School Leader • A – Audience: Families, staff, community members • F – Form: Elevator Speech • T – Topic: Multiple Measurement Rating and Focus Rating
Elevator Speech Complete the writing prompt • In MMR in 2011: • We got the most points from… • We got the fewest points from… • In Focus Rating in 2011: • We got more points from… • We got less points from…
Report out: Going up • In MMR - Stand up if your highest was: • Proficiency • Growth • Gap reduction • Graduation (HS only) • In Focus Rating - Stand up if your highest was: • Gap reduction • Focus proficiency
Reading between the dots:MAP Progress Toward Proficiency Objective: A protocol to analyze data to determine the rate of progress toward a target.
Framing Issues and Key Concepts • Managing the gapbetween current levels of proficiency and expectation is what our mission is all about. • The two critical pieces of information we need are: • How big is the gap? • How much time do we have to close it? • The answers to these questions define our instructional mission.
Steps (a) and (b) 16 6 8 Step (b) Step (a) Grade Level: 6th Content Area: Reading
(C): Progress toward proficiency 16 8 16 8 =8
(D): Average rate of increase 8 ÷ 8 1
Finding the Average Rate of Progress toward Proficiency MCA-II Reading / All Students 2011-12 District Target = 75% Fall 2011 Winter 2012 Spring 2012 8.0 16.0 16.0 – 8.0 = 8.0 8.0% divided by 8 months = 1% rate of growth per month
(e) and (f): To Proficiency 75 16 59 59 1 59
(g) and (h): Time to Proficiency • It would take 4 years 11 months to close the gap.
Next Steps: • Are you happy with: • % of studentson target for proficiency? • Based on your calculations, is this rate of progress adequate or acceptable? Why or why not? • Implications for your SCIP: • Given that we must increase the % of students who move to proficiency at an accelerated pace, how have you done with the rate over the past year and what does this information mean to you for the next 5 years? • Use this protocol to analyze your own data.
Possible Conclusions • What we have been doing has not been predictably effective for ALL of our kids • If we want to become more effective, we can’t do the same things harder, faster or longer • We need to do different things that are more effective
So… how? 1. Decide what is important for students to know. 2. Teach what is important for students to know. 3. Keep track of how students are showing what they know. 4. Make changes according to the data and results you collect! David Tilly, 2005
Problem Solving Process Define the Problem • Defining Problem/Directly Measuring Behavior Problem Analysis • Validating Problem • Identify Variables that contribute to problem • Develop Plan Evaluate • Response to Instruction & Intervention (RtI2) Implement Plan • Implement As Intended • Progress Monitor • Modify as Necessary
Slicing the Pie:Analyzingthe Viewpoint Growth vs. Proficiency Report
Objectives: • To access the Viewpoint Growth vs. Proficiency Report • To examine growth vs. proficiency by ethnicity • To consider how this data might support the SCIP
Inquiry Questions: • What percentage of my students (overall) met targeted growth and are proficient? Did not meet growth and are not proficient? • Which student group (ethnicity, grade level) had the most students making targeted growth? • Which student group (ethnicity, grade level) had the least number of students making targeted growth? • Who are they? How can we act?
Subject: Reading Start Season: Fall 2011 Test Status: Tested (Both Seasons) Scale: SPPS Targets - All Students End Season: Spring 2012 MAP Growth vs Proficiency School Name 2011 - 2012 Status: Active Students Only