Optimizing Watershed Planning for Algae Reduction: Modeling and Assessments
This study focuses on watershed-scale suspended algae prevalence and planning to refine limits for small streams. Long-term averages driven by critical flow considerations and downstream impacts are evaluated, with a focus on non-point reductions and immediate reaches. The use of 8-digit HUC background data reveals current standards often exceeding guidelines, with proposed reductions from lake TMDLs showing promise. Modeling in the MN R River basin predicts significant improvements for TP, essential for future assessments based on specific criteria. Threshold concentrations, stressor identification, and quantile regression are key areas of study.

Optimizing Watershed Planning for Algae Reduction: Modeling and Assessments
E N D
Presentation Transcript
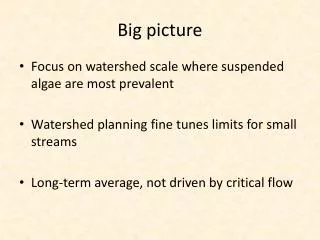
Big picture • Focus on watershed scale where suspended algae are most prevalent • Watershed planning fine tunes limits for small streams • Long-term average, not driven by critical flow
Considerations • Critical condition/flow • Downstream impacts • Transport • Non-point reductions • Compliance point • Immediate reach • 8 digit HUC
Background • Current “background” is above standards • Assume reductions from proposed lake TMDLs • Assume reductions from approved turbidity TMDLs • Modeling in MN R basin for turbidity predicts dramatic improvements for TP
Draft river eutrophication criteria (summer-means). • Future assessments based on: • Minimum of 2 summers & 6 or more obs./summer; • Data from most recent 10 years; • Must exceed cause & one or more response (stressors)to be deemed impaired (303(d) listed)
Draft criteria compared to RNR-based TP distribution. Reflects distinct regional patterns Based on summer-mean STORET data from 1995-2009 for: 128 (North), 239 (Central) and 209 (South) river sites.
Outlet or every stream mile? 150 ug/L 150 ug/L 150 ug/L 150 ug/L 150 ug/L 150 ug/L 150 ug/L 150 ug/L
Fantasy vs reality 150 ug/L 150 ug/L 150 ug/L 140 ug/L 100 ug/L 150 ug/L 150 ug/L 160 ug/L 145 ug/L 150 ug/L 150 ug/L 175 ug/L 200ug/L 150 ug/L 150 ug/L
Response variables • Set limits based on TP • Modeling response variables will require additional resources and time • Is Chl-a more valuable than BOD
Topics that need attention • Stabilization ponds • Mass vs concentration limits • Calculating non-point reductions • Stressor id is the proposed path for small streams • Biology and periphyton • Habitat, nutrients, tss, contaminents…..
Quantile (piece-wise) regression (with CI) describes relationships & ID threshold concentrations. Mid-point of 2 breakpoints used to interpolate TP.
Threshold Concentrations Threshold concentrations from biological tests for: • Region: north, central, and south • River size: nonwadeable and wadeable • Biological group: Fish and invertebrate