Context Matters: Understanding Evidence in Critical Thinking
370 likes | 488 Vues
This article emphasizes the importance of context in evaluating evidence and quotes, discussing how information can be misrepresented or misunderstood without proper context. It covers topics like selective data points, truncated charts, and the significance of considering long-term trends. By highlighting these critical thinking principles, readers can enhance their analytical skills and avoid falling for misleading information.

Context Matters: Understanding Evidence in Critical Thinking
E N D
Presentation Transcript
The Big Picture GEA 101 Critical Thinking
The Importance of Context When someone provides you with evidence for a truth-claim, you have to ask: Does this evidence really support the claim? Is there other relevant evidence I should look for before assessing the claim?
What the Ad Says “a small masterpiece” --Entertainment Weekly
What the Reviewer Said “The credit sequence, with its jumpy frames and near-subliminal flashes of psychoparaphernalia, is a small masterpiece of dementia… B-”
Every quote is taken out of its original context. That’s why it’s a quote and not a reproduction. This is fine if the person providing the quote has also provided enough context that the quote does not mislead you into thinking someone meant something they did not mean.
What Darwin Said “To suppose that the eye with all its inimitable contrivances for adjusting the focus to different distances, for admitting different amounts of light, and for the correction of spherical and chromatic aberration, could have been formed by natural selection, seems, I freely confess, absurd in the highest degree…”
What Darwin Said “…Yet reason tells me, that if numerous gradations from a perfect and complex eye to one very imperfect and simple, each grade being useful to its possessor, can be shown to exist; if further, the eye does vary ever so slightly, and the variations be inherited, which is certainly the case; and if any variation or modification in the organ be ever useful to an animal under changing conditions of life, then the difficulty of believing that a perfect and complex eye could be formed by natural selection, though insuperable by our imagination, can hardly be considered real.”
But it is not just words that can be deprived of the context that is needed to understand their significance…
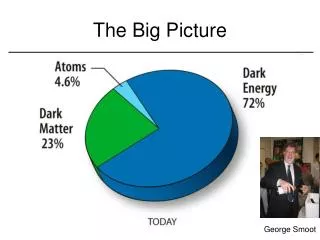
Global Cooling in the last 10yrs? Claim: The Earth is cooling. Evidence: This graph, from the past 10 years. Key: blue line = temperature, black line = CO2 levels
Trends When you see a chart describing what happened in the last 10 years, or last 10 months, or last 10 weeks, you’re seeing the information out of context. What happened before then? Sometimes short-term trends are all that matter. I don’t care about the stock market 20 years ago. But sometimes it’s the longer trend that matters, as in the global warming trend.
Truncated Charts When the y-axis of a chart does not start at zero (a “zero baseline”), you’re seeing what’s called a “truncated”, “torn” or “gee whiz” graph. You’re seeing the information it presents out of context. What seems like a 400% increase might actually be an increase of less than 12%. If no numbers at all are on the y-axis, the chart tells you almost nothing at all.
Truncated Charts Sometimes truncated charts are OK, for example, when tiny changes make very big differences (like fluctuations in stock prices), or when people are very familiar with the information be presented (like charts of the daily temperature… it would be silly to start them at 0 Kelvin, which is -273.15 Celsius).
Always check the axes of your charts to know what you’re looking at. If a chart is truncated, that can be a warning sign. Do the size differences on the chart correspond to the difference in importance of the numbers charted? If they don’t, the chart is misleading.
Scales It’s not just where the axes on the chart begin, but also how they increase. We’re used to thinking that equal sizes correspond to equal measures, but when the scale of the chart is changed, this might not be true. In this example, an 8 point change is roughly twice the length as a 12 point change:
Selective Data Points As in the case of the global warming charts and the truncated charts, what is presented is not false, it’s just misleading. What’s misleading is that a small portion of information is presented, that indicates an overall trend– when this trend doesn’t exist, or is even the opposite. This can be done with almost any data…
Selective Data Points In this chart, the cost of gasoline is shown as moving steadily upward, from USD$3.17 to USD$3.51 to USD$3.57. You’re led to believe that gas prices on average increased over the time indicated on the chart
Selective Data Points If you just look at 1 Feb 2011, 1 Jan 2012, and 1 Feb 2012, prices have gone consistently up. However, this ignores the clear trend, that prices have been consistently decreasing since May of 2011.
Context: Absolutes and Comparatives The Russian Academy of Medicine estimates that there are 1 million Russians infected with HIV/ AIDS. Consider these two claims: Claim: There is an AIDS epidemic in Russia. Claim: AIDS is not a serious problem in Russia.
Which claim is closer to the truth? Well, it depends. It depends on how many people there are in Russia. It turns out there are 142 million Russians. So the rate of infection is 1/142, or 0.7%. It also depends on what the rate is in other countries. Is 0.7% high or low?
Claim: You should not go skydiving. Evidence: You’re 8.75 times more likely to die skydiving than skiing! So if 10% of skiiers die, 87.5% of skydivers die!
But those aren’t the numbers. If you go skiing one time on one day, you have a 0.8 in a million chance of dying. If you go skydiving one time on one day, you have a 7 in a million chance of dying. Maybe you still don’t want to go, but context certainly affects that decision, doesn’t it!
Summary Absolute numbers can be misleading. India has about 330,000 people in prison. A lot or a little? Rates can also be misleading. Russia has 615 prisoners for every 100,000 people. A lot or a little? Even comparisons can be misleading. If country X has twice as many people in prison today than in 1990, is that bad? What if they have twice as many residents than in 1990?
What does it mean? One way absent context can be misleading is when normal words are being used in a special way, and that fact is not indicated. A clear statement of what is being discussed is important context that should not be omitted.
Regnerus Study Here was a headline from CBS News regarding a study published by Mark Regnerus, at the University of Texas at Austin: “Kids of Gay Parents Fare Worse, Study Finds” But something is strange here. Other studies have found in the past that gay parents are better. What could be going on?
Regnerus Study In the study, participants were asked about a number of personal details– did they use drugs? Did they think of committing suicide? Were they happy? They were also asked about how they were raised. In stable families? Did their parents get divorced? Were they raised by single mothers?
Regnerus Study If the children were raised by two opposite-sex parents for their entire childhood, they were raised by their “still intact biological families,” one of the two main comparison groups in the study. If they were raised by a parent or parents who, at any point, had a same-sex relationship, they were raised by “gay parents,” the other group.
Regnerus Study Only 2 of the 15,000 people randomly contacted for the study were raised by gay parents for their entire childhood (18 years). Only 8 were raised by gay parents for at least 10 years. (The 2 before + 6 more) Only 18 were raised by gay parents for at least 5 years. (The 8 before + 10 more)
Regnerus Study Most “children of lesbian mothers” were children raised in single-parent households, after the divorce of their opposite-sex parents (who they lived with longer), where their single mother had a short-term relationship with another woman. All “children of still intact biological families” were raised in stable 2-parent households for their entire childhood.
What does it mean? “Kids of Gay Parents Fare Worse, Study Finds” “Kids whose parents at one point had same-sex relationships, of any duration, and who may have lived in single-parent homes with divorced parents, do worse than kids raised by the same two heterosexual parents for their entire childhood.”
Similar Example You can find people making the claim that blacks are “less intelligent” than whites or Asians. Why? Because they score lower on intelligence tests. One important question to ask, though, is: “Do intelligence tests actually measure intelligence?”