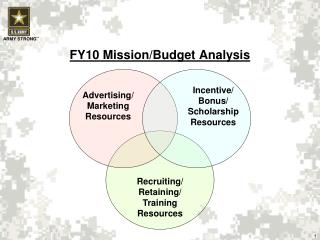
Testbed Origin - FY10 IOOS Budget
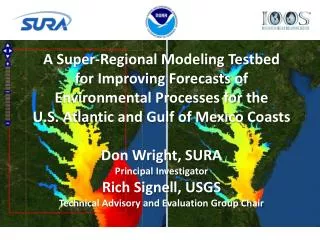
A Super-Regional Modeling Testbed for Improving Forecasts of Environmental Processes for the U.S. Atlantic and Gulf of Mexico Coasts Don Wright, SURA Principal Investigator Rich Signell , USGS Technical Advisory and Evaluation Group Chair. Testbed Origin - FY10 IOOS Budget.

Testbed Origin - FY10 IOOS Budget
E N D
Presentation Transcript
A Super-Regional Modeling Testbed for Improving Forecasts of Environmental Processes for the U.S. Atlantic and Gulf of Mexico CoastsDon Wright, SURAPrincipal InvestigatorRich Signell, USGS Technical Advisory and Evaluation Group Chair
Testbed Origin - FY10 IOOS Budget “$4,000,000 is for a competitive extramural regional test bed… to understand, predict, and mitigate the consequences of both extreme events and chronic conditions in the U.S. Atlantic and Gulf regions. Such a test bed should include no less than 20 academic partners and research institutions to guarantee… community-modeling”
Improving Forecasts of Coastal Environmental Processes • Factors: Open boundary conditions, met and river forcing conditions, physics vs. parameterizations, data assimilation approach, amount of data assimilated, numerics, vertical and horizontal resolution, model coupling. • “Which model is better?” is often not the right question. What factors in the simulation resulted in a better solution? How much better? At what cost? • Improving cyberinfrastructure leads to greater access by more people, and leads to faster improvements
Defining Improvement • To measure improvement for environmental processes, we need to define skill metrics for specific environmental processes and often for specific region • Inundation, search and rescue, deep oil spills, navigation, hypoxia, harmful algal blooms, diver operations, ocean energy siting, beach erosion, regional impact of climate change, all require different skill metrics • Operational centers need community help in this process – too broad for the National Backbone!
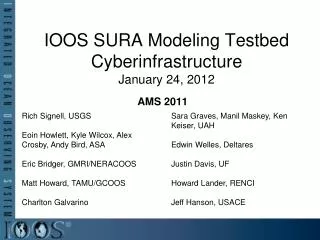
A Common Cyberinfrastructure for Model Data The ocean community needs a common cyberinfrastructure to access, analyze and display data from the different models: each model currently has their own standards and toolsets Structured Grids Unstructured Grid 10 nodes 5x5 6x3 Variety of Stretched Vertical Coordinates
Testbed Goals • Develop skill metrics and assess models in three different regions and dynamical regimes • Build a common infrastructure for access, analysis and visualization of all ocean model data produced by the National Backbone and the IOOS Regions. • Transition models, tools, toolkits and other capabilities to federal operational facilities • Build stronger relationships between academia and operational centers through collaboration
IOOS Testbed Team Structure 8 members 25 members Don Wright, SURA Rich Signell, USGS Doug Levin, NOAA/IOOS Liz Smith, SURA EoinHowlett, ASA 20 members 21 members 17 members Carl Friedrichs, VIMS John Harding, MSU Rick Luettich, UNC-CH
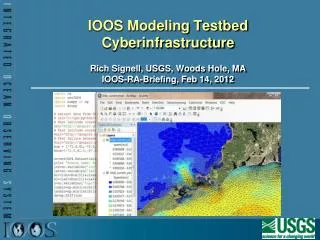
Mapping services and browse application • Cyberinfrastructure (CI)All Regions – All Teams • Extending CI from OGC, Unidata and others (NOAA DMIT, USGS CDI) to support unstructured grids, and add functionality • Web Access via OpenDAP w/CF • Unidata Common Data Model/NetCDF Java Library API • Distributed search capability • Browser based map viewer (WMS) • Toolbox for scientific desktop analysis • All components standards-based! Search services Analyze in scientific desktop application
Inundation Extra-tropical – Gulf of MaineTropical – Gulf of Mexico- 4 models: 3 unstructured grid +1 structured grid- Coupled wave-storm surge-inundation (TWL)- Consistent forcing, validation and skill assessment using existing IMEDS tool • Extensive observational data sets for historical storms Ike, Rita and Gustav in standard formats • SURA has provided supercomputer resources Extratropical Grid Tropical Grids for Galveston Bay
Inundation Successes • High quality grids, forcing, and extensive observational data for specific storms publically available for community testing • Direct comparisons between operational inundation models (e.g., SLOSH) with academic community models • Community building within research community by modeling groups working together • Improved academic - government relationship through partnership
Inundation Team Federal Partners • Jesse Feyen(NOAA) – NOAA Storm Surge Road Map • Amy Hasse (NOAA NWS) - Met Development Lab • Jeff Hanson (USACE) – Model skill assessment • Jamie Rhome (NOAA Natl Hurricane Center) – Storm surge unit lead • HendrikTolman (NOAA NCEP) – Transition to operations Non-Federal Partners • Rick Luettich (UNC) – Lead • Bob Beardsley (WHOI) – FVCOM extra-tropical, skill assessment • ChangshengChen (UMASS-Dartmouth) – FVCOM • ChunyanLi (LSU) – FVCOM tropical • Aaron Donahue (Notre Dame) – ADCIRC tropical, skill assessment • Dave Forrest (VIMS) – ELCIRC SELFE • Will Perrie (Bedford Institute of Oceanography) – Wave modeling • Don Slinn (UF) – SLOSH • Harry Wang (VIMS) – ELCIRC SELFE • JoannesWesterink (Notre Dame) - ADCIRC • Bob Weisberg (USF) – FVCOM • LianyuanZheng (USF) - FVCOM
Shelf Hypoxia Gulf of MexicoHydrodynamic & biogeochemical hindcastcomparisons of hypoxia model (stand alone) coupled to 3 different Gulf of Mexico hydrodynamics models Evaluation of two shelf hypoxia formulations (NOAA & EPA)
Shelf Hypoxia Successes • Hypoxia code: Fennel ROMS => NOAA FVCOM (NOAA contact: Rich Patchen, CSDL) • Consolidated multi-year hypoxia data set available for NOAA Hypoxia Watch Data Portal (NOAA contact: Scott Cross, NCDDC) • Accelerated development of NOAA NCDDC OceanNOMADS capability as Navy “White Front Door” for archived operational ocean nowcast/forecast products (NOAA:Scott Cross) • Supporting transition of U.S. Navy operational Gulf of Mexico regional ocean nowcast/forecast capability (NAVY: Frank Bub, NAVO)
Shelf Hypoxia Team Federal Partners • Frank Bub (NAVOCEANO) – Advisor, Transition to operations • Scott Cross (NESDIS/NODC/NCDDC) – East Coast Regional Science Officer • Richard Greene (EPA) – Ecosystem Dynamics • John Lehrter (EPA) – Ecologist • Alan Lewitus (NOAA) – Advisor • Rich Patchen (NOAA/OCS/CSDL) – Modeling, transition to operations CSDL • Dong Ko (NRL-EPA) – Modeling • Eugene Wei (NOAA/OCS/CSDL/MMAP) – Modeling • JiangtaoXu (NOAA/OCS/CSDL) – Hypoxia modeling Non-Federal Partners • John Harding (MSU) – Team Leader • KatjaFennel (Dalhousie Uni) – Biogeochemical modeling • Pat Fitzpatrick (MSU) – Modeling of hurricanes, weather forecasting • Courtney Harris (VIMS) – Numerical modeling, sediment transport • Rob Hetland (TAMU) – Hydrodynamic modeling • Bruce Lipphardt (Udel) – Model skill assessment using observations • Steve Morey (FSU) – Navy Coastal Ocean Model (NCOM) • Jerry Wiggert (USM) – Coupled physical-biogeochemical modeling
Estuarine Hypoxia Chesapeake Bay 1. Estuary: – 5 Hydrodynamic models – 3 Biological (DO) models – 2004 data from 28 CBP stations – Comparing T, S, max (dS/dz), DO via target diagrams 2. Shelf: OBCs 5 hydrodynamic models Dissolved Oxygen Stratification (dS/Dz) Models doing better on oxygen than stratification!
Hypoxia in Chesapeake Bay • Variations in river inflow have little effect • DO has no correlation with stratification • Simple 1 term model for DO works as well as watershed nutrient loading, 11 component, fully 3D water quality model • Extent of hypoxia zone is strongly related to wind direction!
Testbed Year 1 Products • Skill metrics and identification of key performance factors and cost for three important dynamical regimes and environmental issues • Foundation of a cyberinfrastructure framework for search, access and display of all Federal Backbone & RA model data, via browser and scientific desktop application • CONOPSfor transition from research to operations • Improved communication between research and operations
Future Work for the Testbed • Expand to more regions and more coastal issues • Examine more factors (e.g. data assimilation approaches, model coupling) • Build out the cyberinfrastructure(more functionality, toolboxes for other languages, web services, outreach, training) • Find a way to sustain testbed activities
Curvilinear Horz., Stretched Vertical Grid Curvilinear orthogonal horizontal coordinates Stretched surface and terrain following vertical coordinates
Stovepiped Model Data Access The GoMOOS Nowcast/Forecast Circulation Model (University of Maine)
Comparing Models with Data in Matlab Model 1: UMASS-ECOM Model 2: UMAINE-POM Data: SST 2008-Sep-08 07:32
14 Different Ocean Forecast Models Spanning CONUS Waters in IDV