Download
1 / 67
670 likes | 827 Vues
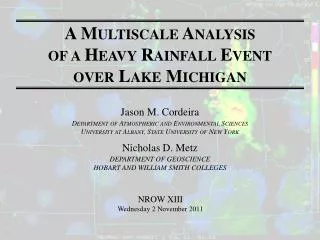
A Multiscale Analysis of a Heavy Rainfall Event over Lake Michigan. Jason M. Cordeira. Department of Atmospheric and Environmental Sciences University at Albany, State University of New York. Nicholas D. Metz. DEPARTMENT OF GEOSCIENCE HOBART AND WILLIAM SMITH COLLEGES. NROW XIII

E N D
A Multiscale Analysis of a Heavy Rainfall Event over Lake Michigan Jason M. Cordeira Department of Atmospheric and Environmental Sciences University at Albany, State University of New York Nicholas D. Metz DEPARTMENT OF GEOSCIENCE HOBART AND WILLIAM SMITH COLLEGES NROW XIII Wednesday 2 November 2011
Objectives • To investigate far-upstream precursors to heavy rainfall events (HREs) in the Great Lakes region • To investigate the possible role of Lake Michigan (LM) on difficult to predict HREs in the Great Lakes region
Outline • Motivation • Radar overview • Far-upstream precursors • Synoptic-scale and mesoscale analysis • WRF simulation
Outline • Motivation • Radar Overview • Far-upstream precursors • Synoptic-scale and mesoscale analysis • WRF simulation
MOTIVATION – PRECIPITATION TOTALS 48-h precipitation totals ending 0000 UTC 2 July 2011 • 48-h precipitation totals >150 mm (>6 in) over LM • 48-h precipitation totals ~100 mm (~4 in) over northern Indiana image source: http://nmq.ou.edu
MOTIVATION – PRECIPITATION TOTALS 24-h precipitation totals ending 0000 UTC 2 July 2011 24-h precipitation totals ending 0000 UTC 1 July 2011 • Valparaiso, IN • 91.7 mm precipitation on 1 July 2011 • 100.8 mm precipitation in 24-h period ending 0000 UTC 2 July 2011 • 30-d precipitation ending 0000 UTC 1 July 2011: 87.4 mm • 30-d precipitation ending 0000 UTC 2 July 2011: 188.2 mm • 1-in-5-yr event (http://hdsc.nws.noaa.gov/hdsc/pfds/) image source: http://nmq.ou.edu
MOTIVATION – SEVERE WEATHER 1 July 2011 Storm Reports 30 June 2011 Storm Reports • Severe weather confined to Chicago region overnight 30 June to 1 July 2011 • Subsequent severe weather event over MN, WI, IA, SD late on 1 July 2011 image source: http://www.spc.noaa.gov image courtesy ABC-7 Chicago
MOTIVATION – NAM (WRF-NMM) QPF Area-averaged accumulated precipitation (28 June forecasts) NCEP 4-km stage IV Area-averaged domain: NAM (WRF-NMM)
MOTIVATION – NAM (WRF-NMM) QPF Area-averaged accumulated precipitation (29 June forecasts) NCEP 4-km stage IV Area-averaged domain: NAM (WRF-NMM)
MOTIVATION – NAM (WRF-NMM) QPF Area-averaged accumulated precipitation (29 June forecasts) Forecasts largely miss 1800 UTC 30 June to 0600 UTC 1 July precipitation NCEP 4-km stage IV Area-averaged domain: NAM (WRF-NMM)
Outline • Motivation • Radar overview • 1800 UTC 30 June – 0600 UTC 1 July 2011 • Far-upstream precursors • Synoptic-scale and mesoscale analysis • WRF simulation
RADAR OVERVIEW – 30 JUNE–1 JULY 2011 1200 UTC 30 June image source: http://locust.mmm.ucar.edu/
RADAR OVERVIEW – 30 JUNE–1 JULY 2011 1300 UTC 30 June image source: http://locust.mmm.ucar.edu/
RADAR OVERVIEW – 30 JUNE–1 JULY 2011 1400 UTC 30 June image source: http://locust.mmm.ucar.edu/
RADAR OVERVIEW – 30 JUNE–1 JULY 2011 1500 UTC 30 June image source: http://locust.mmm.ucar.edu/
RADAR OVERVIEW – 30 JUNE–1 JULY 2011 1600 UTC 30 June image source: http://locust.mmm.ucar.edu/
RADAR OVERVIEW – 30 JUNE–1 JULY 2011 1700 UTC 30 June image source: http://locust.mmm.ucar.edu/
RADAR OVERVIEW – 30 JUNE–1 JULY 2011 1800 UTC 30 June image source: http://locust.mmm.ucar.edu/
RADAR OVERVIEW – 30 JUNE–1 JULY 2011 1900 UTC 30 June image source: http://locust.mmm.ucar.edu/
RADAR OVERVIEW – 30 JUNE–1 JULY 2011 2000 UTC 30 June image source: http://locust.mmm.ucar.edu/
RADAR OVERVIEW – 30 JUNE–1 JULY 2011 2100 UTC 30 June image source: http://locust.mmm.ucar.edu/
RADAR OVERVIEW – 30 JUNE–1 JULY 2011 2200 UTC 30 June image source: http://locust.mmm.ucar.edu/
RADAR OVERVIEW – 30 JUNE–1 JULY 2011 2300 UTC 30 June image source: http://locust.mmm.ucar.edu/
RADAR OVERVIEW – 30 JUNE–1 JULY 2011 0000 UTC 1 July image source: http://locust.mmm.ucar.edu/
RADAR OVERVIEW – 30 JUNE–1 JULY 2011 0100 UTC 1 July image source: http://locust.mmm.ucar.edu/
RADAR OVERVIEW – 30 JUNE–1 JULY 2011 0200 UTC 1 July image source: http://locust.mmm.ucar.edu/
RADAR OVERVIEW – 30 JUNE–1 JULY 2011 0300 UTC 1 July image source: http://locust.mmm.ucar.edu/
RADAR OVERVIEW – 30 JUNE–1 JULY 2011 0400 UTC 1 July image source: http://locust.mmm.ucar.edu/
RADAR OVERVIEW – 30 JUNE–1 JULY 2011 0500 UTC 1 July image source: http://locust.mmm.ucar.edu/
RADAR OVERVIEW – 30 JUNE–1 JULY 2011 0600 UTC 1 July image source: http://locust.mmm.ucar.edu/
RADAR SUMMARY – 30 JUNE–1 JULY 2011 System 1 System 2 System 3 System 4 17 00 18 22 01 02 03 19 Convection features four quasi-linear systems: • System 1: 1700 UTC 30 June to 2100 UTC 30 June 2011 • System 2: 2200 UTC 30 June to 0300 UTC 1 July 2011 • evolves into two right-moving supercells (×) • System 3: 0000 UTC 1 July to 0400 UTC 1 July 2011 • System 4: 0300 UTC 1 July to 0500 UTC 1 July 2011 04 23 20 00 03 × 04 05 21 01 × × 02 01 × 02 × 03
Outline • Motivation • Radar overview • Far-upstream precursors • Synoptic-scale and mesoscale analysis • WRF simulation
Far-upstream precursors • The evolution of the large-scale flow over North America is often influenced by variability in the large-scale flow over North Pacific • Variability in the large-scale flow over North Pacific is often influenced by tropical cyclones
Far-upstream precursors • The evolution of the large-scale flow over North America is often influenced by variability in the large-scale flow over North Pacific • Variability in the large-scale flow over North Pacific is often influenced by tropical cyclones • What is the influence of tropical storms Haima and Meari on the evolution of the large-scale flow over North America? Tropical Storm Haima (18–25 June 2011) Tropical Storm Meari (22–27 June 2011) Haima Meari image source: http://agora.ex.nii.ac.jp/digital-typhoon/index.html.en
Far-upstream precursors 0000 UTC 22 June 2011 Precipitable water (mm; shade), 850-hPa rel. vor. (10−4 s−1; white), DT wind speed (m s−1; black), and 700-hPa wind (knots; barbs) H M source: 0.5° NCEP–GFS
Far-upstream precursors 0000 UTC 24 June 2011 Precipitable water (mm; shade), 850-hPa rel. vor. (10−4 s−1; white), DT wind speed (m s−1; black), and 700-hPa wind (knots; barbs) M H source: 0.5° NCEP–GFS
Far-upstream precursors 0000 UTC 24 June 2011 Precipitable water (mm; shade), 850-hPa rel. vor. (10−4 s−1; white), DT wind speed (m s−1; black), 300–200-hPa PV (PVU; thin black), and 250-hPa irrotational wind (m s−1; vectors) 10 m s−1 M H source: 0.5° NCEP–GFS
Far-upstream precursors 0000 UTC 26 June 2011 Precipitable water (mm; shade), 850-hPa rel. vor. (10−4 s−1; white), DT wind speed (m s−1; black), and 700-hPa wind (knots; barbs) L M source: 0.5° NCEP–GFS
Far-upstream precursors 0000 UTC 26 June 2011 DT potential temperature (K; shade), DT wind speed (m s−1; black), DT wind (knots; barbs), and 850-hPa rel. vor. (10−4 s−1; white) L M source: 0.5° NCEP–GFS
Far-upstream precursors 0000 UTC 26 June 2011 DT potential temperature (K; shade), DT wind speed (m s−1; black), DT wind (knots; barbs), and 850-hPa rel. vor. (10−4 s−1; white) Shifted domain source: 0.5° NCEP–GFS
Far-upstream precursors 0000 UTC 28 June 2011 DT potential temperature (K; shade), DT wind speed (m s−1; black), DT wind (knots; barbs), and 850-hPa rel. vor. (10−4 s−1; white) source: 0.5° NCEP–GFS
Far-upstream precursors 0000 UTC 30 June 2011 DT potential temperature (K; shade), DT wind speed (m s−1; black), DT wind (knots; barbs), and 850-hPa rel. vor. (10−4 s−1; white) source: 0.5° NCEP–GFS
Far-upstream precursors 0000 UTC 30 June 2011 DT potential temperature (K; shade), DT wind speed (m s−1; black), DT wind (knots; barbs), and 850-hPa rel. vor. (10−4 s−1; white) source: 0.5° NCEP–GFS
Far-upstream precursors 0000 UTC 30 June 2011 700–500-hPa lapse rate (K km−1; shade), 700–500-hPa wind (knots; barbs), and 200-hPa geo. height (dam; black) DTθ source: 0.5° NCEP–GFS
Far-upstream Precursors 20 June–10 July 2011 700–500-hPa lapse rate (K km−1; shade), 250-hPa meridional wind anomaly (every 10 m s−1; red/blue contours), and 250-hPa zonal wind speed (every 5 m s−1 starting at 30; dash) 40°–50°N source: 0.5° NCEP–GFS
Far-upstream Precursors 20 June–10 July 2011 700–500-hPa lapse rate (K km−1; shade), 250-hPa meridional wind anomaly (every 10 m s−1; red/blue contours), and 250-hPa zonal wind speed (every 5 m s−1 starting at 30; dash) 40°–50°N L “PRE”
Outline • Motivation • Radar overview • Far-upstream precursors • Synoptic-scale and mesoscale analysis • WRF simulation
SYNOPTIC-SCALE AND MESOSCALE ANALYSIS 1800 UTC 30 June 2011 250-hPa geo. height (dam; solid) and wind speed (m s−1; shade), and 850-hPa wind (knots; barbs) Low-level jet source: RUC 20-km
Synoptic-scale and mesoscale analysis 1800 UTC 30 June 2011 1000–500-hPa thick (dam; dash), SLP (hPa; solid), 925-hPa mixing ratio (g kg−1; shade), and 10-m wind (knots; barbs) source: RUC 20-km
Synoptic-scale and mesoscale analysis 1800 UTC 30 June 2011 Most-unstable CAPE (J kg−1; shade) and 0-to-6-km shear (knots; barbs) source: RUC 20-km