Understanding Graphs and Data Relationships: Types, Uses, and Their Importance
Explore the different types of graphs and their practical applications in our daily lives. Learn how data is presented visually and the significance of neat and organized data formats. This guide examines data relationships, such as the correlation between hours studied and test performance, and how frequency tables are used to organize and display data, like monthly temperature records. Understanding these concepts enhances our ability to analyze information effectively and make informed decisions based on data trends.

Understanding Graphs and Data Relationships: Types, Uses, and Their Importance
E N D
Presentation Transcript
Graphs and data relationships October 28, 2013
Graphs • What are the different types of graphs? • How are they used? • Why do we use them in our lives?
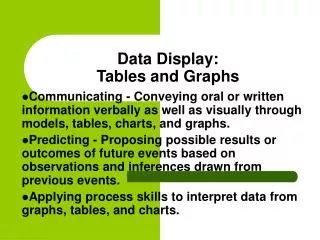
Data • How do we show data? • Why is it important to have it in a neat and organized fashion? • How can data be presented?
Data Relationships Hours the students studied vs. how many passed the test
Frequency tables • Used to organize data in a table that shows the number of times each data value appears.
Frequency tables • Make a table that reflects the following information. Temperatures last month