Download
1 / 9
90 likes | 241 Vues
The University of Texas at San Antonio. FY12 Annual Financial Report Operating Statement (SRECNA) Highlights February 19, 2013 . Annual Financial Report Highlights. The Annual Financial Report (AFR) is made up of three primary statements with many supporting schedules. Balance Sheet

E N D
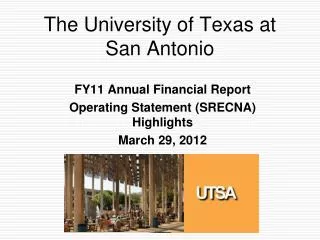
The University of Texas at San Antonio FY12 Annual Financial Report Operating Statement (SRECNA) Highlights February 19, 2013
Annual Financial Report Highlights The Annual Financial Report (AFR) is made up of three primary statements with many supporting schedules. • Balance Sheet • Statement of Revenues, Expenses and Changes in Net Assets (SRECNA) • Statement of Cash Flows
The Statement of Revenue, Expenses, and Changes in New Assets (SRECNA)
UTSA FY12 Sources of Revenue by Category Operating Sources ($ in Millions) Operating Sources by Category ($ in Millions)
UTSA FY12 Sources of Revenue Operating Sources ($ in Millions) Operating Uses ($ in Millions)
Reconciliation of Research Expenditures to AFR Operating Expenses - Research Reconciliation:FY12FY 11 Statement of Revenues, Expenses and 42,750,531 46,104,031 Changes in Net Assets- Research Expenses Facilities and Administration (F&A) 7,613,268 7,275,702 Capital Outlay 4,031,3613,454,128 54,395,160 56,833,861 *Total Research Expenditures * As Reported on THECB Research Expenditure Report
Expense Classification Summary • Salaries/Wages and Other Payroll Related Cost • Professional Fees and Services • Communications • Repairs and Maintenance • Scholarships and Fellowships • Depreciation and Amortization • All Other Classifications • Total Operating Expenses
UTSA FY12 AFR Summary • UTSA continues to receive a “Satisfactory” rating from UT System as a result of a healthy financial condition. • UTSA’s operating margin ratio increased from 2.8% for FY2011 to 4.1% for FY2012. The increase in operating margin is attributable to growth in operating revenues of $17.5M exceeding the growth in total operating expenses of $10.4M.