Download

1 / 50
510 likes | 721 Vues
Asymmetric Information and Agency. Folland et al. chap. 11 Bhattacharya et al. chap. 8. OVERVIEW OF INFORMATION ISSUES Overview of Information Issues.

E N D
Asymmetric Information and Agency. Folland et al. chap. 11 Bhattacharya et al. chap. 8
OVERVIEW OF INFORMATION ISSUESOverview of Information Issues • Adverse selection, a phenomenon in which insurance attracts patients who are likely to use services at a higher than average rate, results from asymmetric information because potential beneficiaries have better information than the insurer about their health status and their expected demand for health care. • The possible preference for health care delivery by nonprofit hospitals and nursing homes has been attributed to patients’ lack of information and inability to discern quality. For some patients, a nonprofit status might be taken as reassurance of higher quality because decisions are made independent of a profit motive.
Goals for this Lecture • Introduce information asymmetry, describe its relative prevalence, and determine its consequences, especially for insurance markets. • Describe the agency relationship and examine some of the problems arising in health care markets from imperfect agency. • Examine the effects of imperfect consumer information on the price and quality of health care services.
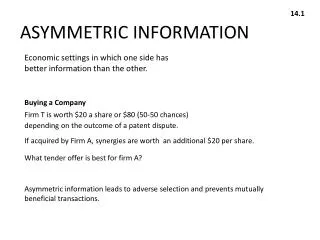
Intro • A man walks into the office of a life insurance company. • He wants to buy a $1 million life insurance policy for a term of one day. Your company will have to pay $1 million to his heirs if and only if he dies tomorrow. • You know nothing else about this man. • How much do you charge?
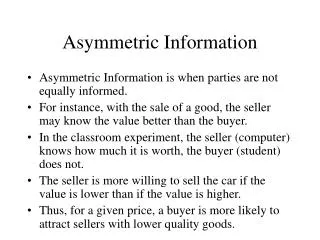
Asymmetric information • Definition: a situation in which agents in a potential economic transaction do not have the same information about the quality of the good being transacted • A major theme of this course, and the source of many problems in health insurance markets
THE INTUITION BEHIND THE MARKET FOR LEMONS Adverse Selection: Akerlof’s Market for Lemons
First: symmetric information • Imagine a well-functioning used car market • Sellers advertise cars, and buyers can accurately assess the condition of each car for sale • Some buyers will be willing to pay more for cars in good condition; others are happy to get a deal • Symmetric information: buyers and sellers have symmetric info about car quality. This is crucial. • Outcome: each car sells for a different price, depending on its quality
First: symmetric information • Pareto-improving transaction: a transaction that leaves all parties at least no worse off • One goal of a market is to make sure all Pareto-improving transactions take place • In the market we have described, there is nothing to stop all Pareto-improving transactions from taking place • All the cars end up with the people who value them the most
Next: asymmetric information • New assumption: sellers can determine car quality, but buyers cannot • All cars look identically good to the buyers • This market will look different from the previous one in several ways: • any cars that sell, sell for the same price • The best cars will not be offered on the market • It is possible that the cars will not end up with the people who value them most (buyers)
Why is there only one price? • Imagine that two cars are offered for different prices in this market: P and P’ > P • No buyer will want to buy the expensive car, because both cars will seem the same • All sellers will have to lower their prices to match the lowest price on the market
Why are some cars not offered? • We know the market has one price P • Consider the seller who owns the nicest car on the market – it is probably worth way more than P • That seller has no reason to remain in the market • Why doesn’t he advertise the high quality of his vehicle and charge a higher price? • Remember, buyers can’t “see” quality • Outcome: only the lower-quality cars stay on the market. This is our first example of adverse selection.
Adverse selection • Definition: the oversupply of low-quality goods, products, or contracts that results when there is asymmetric information. • This is one of the most important ideas in health economics.
What happens to our market? • Recap • Cars only sell at one price • As a result, the best cars leave the market • What do buyers do? • They know the average car remaining on the market is of low quality. • Unless buyers value cars very highly, they will not want to buy these cars. • The market unravels, and potential Pareto-improving transactions do not occur. This is a market failure.
A formal treatment • We will introduce a formal model of the market we discussed in the previous slides. • We will present explicit utility functions and a specific distribution of car quality to make the argument more concrete. • But remember – the logic of the argument is the same as what we just saw.
Seller and buyer utility functions • Sellers and buyers derive utility from the cars they own and other goods • Buyers value cars 50% more than sellers (that’ s why they are buyers in the first place) • Xj = quality of the jth car owned • M = utility from other goods
Distribution of car quality • Car quality X is uniformly distributed between 0 and 100: • X ~ Uniform( 0, 100) • Cars are equally likely to have any quality level between 0 and 100 • You are equally likely to have a car of quality level 50 as you are to have a car of quality 96, 17, π, 54.2828 or any real number between 0 and 100 • We use the term Xi to denote the quality of car I
Information assumptions • Buyers do not know the true quality of a particular car, but they do know a lot. • Buyers know the utility function of the sellers and know the distribution of cars available for sale • They also understand that sellers will withdraw highest-quality cars if the price does not justify selling.
Which cars will sellers offer? • A seller will put a car on the market if selling it will increase his utility. • If a seller sells his car of quality X for P dollars, he loses X units of utility but gains P dollars • Hence, he will only put car j on the market if P >Xj
When will buyers buy? • Figuring out when buyers buy is trickier due to uncertainty. • Like sellers, buyers are trying to maximize utility. But think about a buyer who is considering buying a car of uncertain quality. How does she know what will happen to her utility? • Buyers have to think in terms of expected utility.
When will buyers buy? • Suppose a buyer buys a car in this market. • She pays P dollars and thus loses P units of utility. • She gains a car with expected value E[X|P] • Remember, E[X|P] means “expectation of X conditional on P.” We need to think about P because it affects sellers’ decisions, and hence affects the distribution of quality X. • The buyer’s utility is: • But the buyer does not know the actual value of Xn+1, and hence cannot compute UB(after). However, since she knows Ω(P), and the distribution of cars on the market given Ω(P), she can calculate her expected utility from buying the car. The change in her expected utility is • Hence, buyers will buy if: • The expected marginal benefit of the purchase ( the additional expected utility from car n+1 with quality Xn+ 1) must outweigh the marginal cost of buying it, P.
When will buyers buy? • We need to find E[X|P] to decide if buyers will buy • Remember the distribution of cars now: • The formula for expectation for a uniform distribution is simply the average of the endpoints. So E[X|P] = ½ P
When will buyers buy? • We found E[X|P] = ½ P • We plug that into our condition for buying: 3/2 E[X|P] > P 3/2 * ½ P > P ¾ P > P • This is impossible; hence buyers will not buy for any P! • No cars sell, no Pareto-improving trades take place, the cars stay with sellers (who do not want them as much as the buyers do). The market unravels.
What just happened? • To review: • A single price P is somehow established in the market • Sellers remove all cars of quality greater than P • Of the cars that remain, the average quality (E[X|P]) is only ½ P • Buyers do not like cars enough to buy a car of quality ½ P for a price of P • No cars sell, even though buyers like cars better than sellers and all the cars “should” end up with buyers.
Numerical example • We assume a candidate price of P = $ 50. • X ~ Uniform( 0, 100) • QUESTION: • Will any buyer purchase them?
Numerical example • At this price only cars with quality Xi = 50 reach the market. • Since the distribution of car quality is uniform to begin with, the distribution of car quality conditional on the set of cars that sellers actually sell, Ω(50), will also be uniform. This is a property of uniform random variables. So the cars remaining on the market are uniformly distributed in quality from 0 to 50.
Numerical example • Recall that for a uniform random variable X which varies from a to b, the formula for the expectation of X is E[X]= (b+a)/2 • Applying this formula, taking a as the worst possible car quality and b as the best possible car quality, the average quality of cars remaining on the market when P=$ 50 is 25: • E[Xn+1]= (50+ 0) / 2 = 25 • How do buyers evaluate this distribution of cars that are on the market? We can calculate their expected change in utility from buying car n + 1 by applying the last line of equation: • E[ ∆UB]= 3/2E[ Xn+ 1]- P = (3/ 2 · 25)- 50 = 37.5- 50 =- 12.5 • The expected change in utility for buyers is negative…
What does this used car market have to do with health insurance? • Let’s imagine a health insurance market that is similar to the market we just discussed: • Each customer i has an expected amount of health care costs over the course of the year Xi. • An insurance company offers a single policy with an annual premium P. This full insurance policy covers all health care costs incurred during the year. • Customers are risk-neutral. Customer i will purchase insurance if and only if P is less than his expected health care costs Xi. • The insurers cannot distinguish healthy and sick customers • Expected customer health care costs Xi are distributed uniformly in the population between $0 and $20,000.
What does this used car market have to do with health insurance? • Analogy between these two markets • The “cars” are customers’ bodies • The “sellers” are customers • The “buyers” are insurance companies • The sellers try to convince the buyers that the “cars” are healthy; just as a high-quality car is worth a lot to buyers, a healthy customer is worth a lot to insurers • Just like high-quality cars leave the market when a universal price is set, high-quality bodies will leave the market when a universal premium is set.
Health insurance market • Suppose the insurer offers a contract with premium $10,000 for the year. • What happens? Who stays in the market?
Health insurance market • Only the least healthy people buy insurance; their average health expenditures are $15,000. • The insurer raises premiums to $15,000 the next year.
Adverse selection death spiral • There is nothing to stop this cycle, which is called an adverse selection death spiral. • Definition: successive rounds of adverse selection that destroy an insurance market. • The heart of the problem is adverse selection: only the worst customers stay in the market when the insurer sets the premium. • No way for the insurer to turn a profit in this very simple model.
What if buyers value cars very highly? • Let’s assume new utility functions: • Now buyers value cars much more than sellers. Will this fix the market?
What if buyers value cars very highly? • We need a new condition for buyers: • Recall that E[X|P] = ½ P. This is unaffected by the buyers’ utility function • The condition now holds: buyers will be willing to buy cars at price P. They know the remaining cars are bad but they value them highly enough to pay P for them. • These buyers gain utility from buying a used car on this market, almost no matter the price, even though they are fully aware that sellers withhold the top- quality cars.
What if the government sets a price ceiling? • Suppose a consumer- protection agency decides to set a price ceiling in the market for lemons in an attempt to protect buyers from being gouged by unscrupulous sellers. • What effect does this price ceiling have on the market? • Surprisingly, the answer is almost none! • 3/4 P > P First buyer utility function • 5/2P > P Second buyer utility function • Suppose that sellers charge some price less than the ceiling. They will withhold the top- quality cars just as before – in fact, the price ceiling ensures that the best cars (those more valuable than the price ceiling) never reach the market under any circumstances. • The price ceiling just affects Ω(P), the set of cars that sellers bring to the market.
What if there is a minimum guaranteed car quality? • Our goal is to see whether there are any prices at which transactions do occur. • We find the new average quality of cars on the market by applying the formula for the mean of a uniform distribution • E[Xi]= (P + 10)/ 2 • In this market, we will consider only buyers who value a given car 50% more than sellers. • The change in utility to a buyer from purchasing a car is: • ∆UB = 3/2 · E[Xi]- P = 3/2 · (P+ 10)/ 2 - P = 15/2 – 1/4P implying that buyers will purchase cars so long as ∆UB = 15/2 – 1/4P >= 0 30 - P >= 0 30 >= P • For prices between $ 10 and $ 30, sellers place on the market cars of quality between 10 and P. Buyers buy those cars because their utility increases from doing so. Therefore, this minimum-quality floor guarantees a range of prices where the market can function, even though it does not completely solve the market failure associated with adverse selection.
To sum up • Asymmetric information causes parties to misrepresent themselves • Adverse selection removes high-quality goods from the market, leaving only low-quality • Generally, the market will unravel unless: • Someone values a product highly enough to have a positive change in utility • Government regulation through a price floor promotes a minimum standard of quality • One major concept has been missing in this whole analysis: risk aversion. • The Rothschild-Stiglitz model combines asymmetric information and risk aversion.
THE AGENCY RELATIONSHIPWhat is the Agency Relationship? • An agency relationship is formed whenever a principal (for example, a patient) delegates decision making authority to another party, the agent. • In the physician-patient relationship, the patient (principal) delegates authority to the physician (agent), who in many cases also will be the provider of the recommended services.
Agency and Health Care • The perfect agent physician is one who chooses as the patients themselves would choose if only the patients possessed the information that the physician does. • The problem for the principal is to determine and ensure that the agent is acting in the principal’s best interests. Unfortunately, the interests may diverge, and it may be difficult to introduce arrangements or contracts that eliminate conflicts of interest.
CONSUMER INFORMATION, PRICES AND QUALITYOverview • Would relatively poor consumer information reduce the competitiveness of markets? • Does increasing physician availability increase competition and lower prices as traditional economics suggests? • What happens to quality? • How do consumers obtain and use information?
Consumer Information and Prices • Satterthwaite (1979) and Pauly and Satterthwaite (1981) introduced one of the most novel approaches to handle issues involving consumer information and competition. • The authors identify primary medical care as a reputation good—a good for which consumers rely on the information provided by friends, neighbors, and others to select from the various services available in the market. • Physicians are not identical and do not offer identical services. • Because of this product differentiation, the market can be characterized as monopolistically competitive.
Reputation Goods • Under these conditions, the authors show that an increase in the number of providers can increase prices. • Recall that a typical consumer relies on other consumers for information regarding their experiences with physicians. • Thus, when physicians become numerous, the average number of friends who see any provider diminishes; this, in turn, diminishes the average level of information available. • The consumer’s responsiveness to prices and other practice characteristics depends on his or her knowledge • The economic idea is that reduced information tends to give each firm some additional monopoly power.
The Role of Informed Buyers • The degree to which imperfect price information contributes to monopoly power should not be overemphasized. • A growing body of literature shows that it is sufficient to have enough buyers who are sensitive to price differentials to exert discipline over the marketplace. • These arguments suggest that while imperfect price information will likely produce higher prices, this phenomenon may be substantially limited. • In health care markets, where many services are fully or partially covered by insurance, there are added considerations. While a patient may become less sensitive to price levels and price differentials in the choice of providers, third-party payers, such as insurers, have assumed a monitoring function
Price Dispersion • Nobel Laureate George Stigler (1961) argued that variation in prices will increase under conditions of imperfect consumer information. • Gaynor and Polachek (1994) found that both patients and physicians exhibited incomplete information with the measure of ignorance being one and one-half times larger for patients than for physicians.
Consumer Information and Quality • Because consumers cannot easily monitor quality, the search for information regarding quality can be costly. At the same time, the consequences of poor-quality care can be severe or even fatal. • Despite asymmetric information, patients rely on a variety of countervailing arrangements that are intended to reduce their search costs. These include licensure and certification, the threat of malpractice suits, codes of ethics, etc. • Consider the consumer’s direct role through the Dranove and White argument that the physician–patient relationship enables patients to monitor providers and encourages physicians to make appropriate referrals. • To the extent that many specialists rely on referred patients, these specialists would seem to have incentives to maintain quality. Are they also rewarded with higher prices for higher-quality services?
Haas-Wilson study • To the extent that many specialists rely on referred patients, these specialists would seem to have incentives to maintain quality. Are they also rewarded with higher prices for higher-quality services? • The evidence shows that patients rely on informed sources (agents) for information and that higher quality, as measured by informed referrals, is rewarded by higher fees.