Predictive Analysis of Drug Response Using NSC and LDA Techniques in LCMS Data
This study explores predictive analysis methods, combining NSC and LDA to classify drug responses in a training and testing set using LCMS raw spectra. Focused on Enbrel and Anakinra, we employed five-fold cross-validation to assess predictors among 972 unique features. Key methods include peak finding, feature extraction, and hierarchical clustering, enhanced by ROC and heatmap visualizations. Our findings reveal predictors of clinical response (CR) and pharmacological response (PR), enabling insights into personalized treatment strategies.

Predictive Analysis of Drug Response Using NSC and LDA Techniques in LCMS Data
E N D
Presentation Transcript
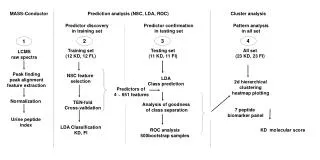
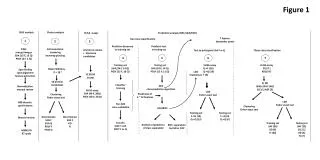
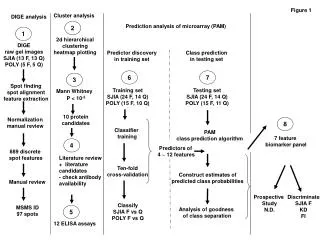
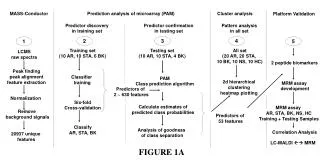
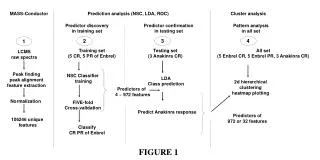
MASS-Conductor Prediction analysis (NSC, LDA, ROC) Cluster analysis Predictor discovery in training set Predictor confirmation in testing set Pattern analysis in all set 2 3 4 1 Training set (5 CR, 5 PR of Enbrel) Testing set (3 Anakinra CR) All set (5 Enbrel CR, 5 Enbrel PR, 3 Anakinra CR) LCMS raw spectra Peak finding peak alignment feature extraction NSC Classifier training LDA Class prediction 2d hierarchical clustering heatmap plotting Predictors of 4 ~ 972 features Normalization FIVE-fold Cross-validation Predict Anakinra response Predictors of 972 or 32 features 106246 unique features Classify CR PR of Enbrel FIGURE 1
FIGURE 2 A Feature number Classification error% Values of thresholds Enbrel PR CR 972 feature panel 32 feature panel B Anakinra CR
Enbrel PR CR 972 feature panel 27 feature panel B Enbrel Anakinra Anakinra CR PR CR CR Predictive probability