Download
1 / 32
330 likes | 559 Vues
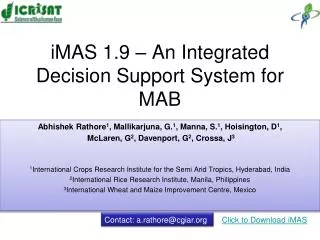
iMAS 1.9 – An Integrated Decision Support System for MAB. Abhishek Rathore 1 , Mallikarjuna, G. 1 , Manna, S. 1 , Hoisington, D 1 , McLaren, G 2 , Davenport, G 2 , Crossa, J 3 1 International Crops Research Institute for the Semi Arid Tropics, Hyderabad, India

E N D
iMAS 1.9 – An Integrated Decision Support System for MAB Abhishek Rathore1, Mallikarjuna, G.1, Manna, S.1, Hoisington, D1, McLaren, G2, Davenport, G2, Crossa, J3 1International Crops Research Institute for the Semi Arid Tropics, Hyderabad, India 2International Rice Research Institute, Manila, Philippines 3International Wheat and Maize Improvement Centre, Mexico Contact: a.rathore@cgiar.org Click to Download iMAS
Few Acronyms Used MABC - Marker Assisted Back Cross QTL - Quantitative Trait Loci MAB - Marker Assisted Breeding BLUP - Best Linear Unbiased Prediction
iMAS • iMAS is a single unified computing and decision support platform • Facilitate identification of trait-linked markers for use in marker-aided selection and breeding • Integrating and implementing the required computational processes, • Providing guidelines for correct application and interpretation of computational tools
iMAS • A Standalone system : Keeping NARS needs in mind • Pipelining freely available quality software / statistical tools • Biometrical Analysis • IRRISTAT (G McLaren, IRRI, Philippines ) • Linkage and QTL Mapping • GMendel (JL Holloway & SJ Knapp, Oregon State University, Oregon, USA) • PlabQTL (HF Utz & AE Melchinger, University of Hohenheim, Germany)
iMAS • Visualization of Linkage and QTL Map Linkage Map • MapChart (RE Voorrips, Plant Research International, The Netherlands) Linkage Map & QTL • GGT (R van Berloo, Laboratory of Plant Breeding, Wageningen University, The Netherlands) • FLAPJACK (Iain Milne, Micha Bayer, Paul Shaw, Linda Cardle and David Marshal, SCRI, Scotland) • MABC Sample Size • PopMin (F Hospital, Ferme du Moulon, France) • QUGene (Scott Chapman, The University of Queensland, Australia) (Experimental)
iMAS Advantages • Genotypic and phenotypic data analysis involves a number of different software • All have different input data format requirements • Manual input file preparation • Time-consuming • Error-prone • Which some time results in: • Use of inappropriate methods • Incorrect use of appropriate methods
Phenotypic Data Genotypic Data
iMAS - Modules iMAS currently implements a mapping-population-based approach to identify trait-linked markers The system consists of six modules - Data Validation module - Phenotyping module - Linkage Map Building module - QTL Analysis module - Genome / QTL Display module - MABC Sample Size module
iMAS - Data Validation • The Data Validation module provides some facilities to • Check basic background information on your data files • Gives an opportunity to correct your data files if necessary, before starting to use iMAS.
iMAS – Phenotyping • Two sub-modules: • Experimental Design • Biometric Analysis • The Experimental Design sub-module helps you select and generate a suitable experimental design for phenotyping • The Biometric Analysis sub-module helps you perform appropriate biometric analysis of resulting phenotyping data to obtain accurate and precise average phenotypic values
iMAS – Linkage & QTL Mapping The Linkage Map Building module generates a linkage map. The QTL Analysis module undertakes QTL analysis based on a linkage map and the average phenotypic values. The required linkage map and the average phenotypic values could either be obtained from inside iMAS or from some other software outside iMAS
iMAS – Genome Display The Genome Display module facilitates graphical display of genomic content of progenies The MABC Sample Size module helps determine the optimal sample size for marker-aided backcrossing
Data Validation - Phenotypic Biometrical Analysis
Data Validation - Phenotypic Biometrical Analysis
Data Validation - Phenotypic Biometrical Analysis
Data Validation - Genotypic Biometrical Analysis
Data Validation - Genotypic Biometrical Analysis
Analysis - BLUPS Biometrical Analysis
Analysis - BLUPS Biometrical Analysis
Analysis - BLUPS Biometrical Analysis
Analysis - BLUPS Biometrical Analysis
Analysis - BLUPS Biometrical Analysis
PLABQTL QTL Mapping • By default Identified QTLs are visualized in Ghost View • However, for more appealing visualization GGT and FLAPJACK can be used from within iMAS
GGT iMAS - Visualization
FLAPJACK iMAS - Visualization