Download
1 / 1
10 likes | 84 Vues
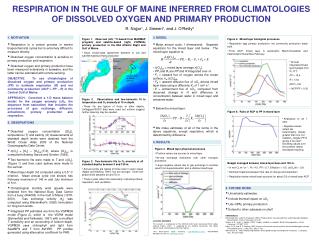
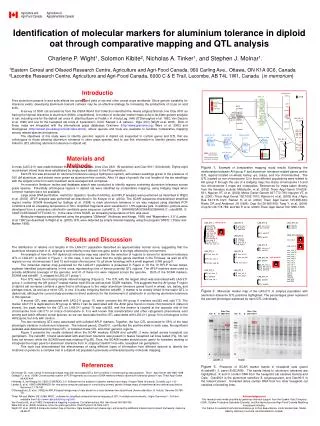
This study identifies genetic markers linked to aluminium tolerance in diploid oat by comparative mapping and QTL analysis. The research aims to develop aluminium-tolerant oat cultivars for increased productivity on acid soils. Utilizing molecular marker maps, the study explores genomic regions in oat orthologous to those affecting aluminium tolerance in other grass species.

E N D
LAG_211_1 LAG_211_4 LAG_211_8 LAG_211_12 [0] aca_caa_7 [0] cdo783 acg_caa_3 [4] cdo57a [4] cdo1428 [0] acc_cat_8 [0] bcd1250 acc_caa_0a acc_cag_4b aca_caa_1 LAG_211_unlinked LAG_211_5 [4] SCA08 acc_cat_2 acg_caa_0 aca_caa_6 acc_caa_0c acc_caa_1 acc_cag_1 acc_cag_4 acc_cat_1 acc_cat_3 acc_cat_7 acc_cat_10 acg_caa_4 acg_caa_6 wg110 wg282 cdo358 cdo1445 bcd1095 acc_caa_0b [12] cdo1174 acg_caa_1 acc_ctc_0 [20] bcd115 [5] calretB1_3 [0] cdo57b LAG_211_9 acc_cag_5 [4] isu1755 [7] acc_caa_4 [7] acc_cat_4 [10] acc_caa_1a acg_caa_5 [0] acg_caa_2 LAG_211_2 LAG_211_6 [5] aco193 LAG_211_10 [0] acc_caa_5 [0] aca_caa_2b [7] acc_caa_0d Barley_G3_4H Barley_G2_4H Barley_G1_4H [0] cdo393 Wheat_G1_4DL bmag84 ebmac775 wg114 [10] aca_caa_2 ebmac9 hvm3 [18] acc_caa_3 Alt_bh hvm68 Alt gene [8] acc_ctc_2 bcd1230 bmag353 bcd1117 LAG_211_3 LAG_211_7 [18] acc_cag_2b [10] acc_ctc_5 Alp cdo1395 acg_ctt_a bcd15 [15] acc_caa_2 cdo1395 acc_caa_e bcd1230 [18] cdo1173 hvm3 acg_caa_c abg472 LAG_211_11 bmac84 bcd1117 Rice_3 Alp [0] acc_cat_6 [0] aca_caa_3 Rye_G1_4R wg464 rg944 [5] acc_cag_2 amal2 cdo1395 [7] cdo1328 Alt3 = Aluminium tolerance QTL cdo665 [0] cdo669 bcd1230 = 10 cM [13] acc_ctc_1 amal4 amal3 [10] bcd454 Rice_Q1_12 Maize_10 rz816a Rice_12 cdo127b (csu359(Alp)) (rg98) npi285 rg574 AH_F (Alm1) cdo127a rz257 (cdo1395) bcd450b rz251 r367 uaz242a rg98 cdo20 cdo1527 rz397 cdo344 cdo541 cdo1246 rg869 bcd446 rz670 rz816b bcd1230 csu70 cdo1395 bcd1250 cdo1516 rg9 rz261 rz397 cdo127 rz261 rg341 rg457 rg445c cdo1049 cdo344 Rice_Q2_12 rg9 rg463 aca_ctg6 uaz318b rg247b (rm17) rg181 cdo426b rg176x cdo459 agg_ctt4 agg_cag5 agg_ctg2 agg_ctg3 aac_ctc5 Rice_Q3_12 me4_1 rg9 rg9 agg_ctg1 rg457 aca_cat6 aca_cat7 rg109a r276 me2_9 rm17 (Some marker names have been removed) rg181 em15_15 rg958 (AH group F) 39% 14% 20% (AH group A) 16% CIav9011 CIav2921 CIav2921 CIav9011 mw O K mw K O B A calretB1_3 SCA08 Identification of molecular markers for aluminium tolerance in diploid oat through comparative mapping and QTL analysis Charlene P. Wight1, Solomon Kibite2, Nicholas A. Tinker1, and Stephen J. Molnar1. 1Eastern Cereal and Oilseed Research Centre, Agriculture and Agri-Food Canada, 960 Carling Ave., Ottawa, ON K1A 0C6, Canada 2Lacombe Research Centre, Agriculture and Agri-Food Canada, 6000 C & E Trail, Lacombe, AB T4L 1W1, Canada (in memorium) Introduction Free aluminium present in acid soils affects the growth and yield of oat and other cereal crops worldwide. Since genetic variability for tolerance exists, developing aluminium-tolerant cultivars may be an effective strategy for increasing the productivity of crops on acid soils. A survey of 3500 oat accessions from the USDA World Oat Collection identified the Avena strigosa Schreb. line CIav 9011 as having the highest tolerance to aluminium (Kibite, unpublished). A number of molecular marker maps exist to facilitate genetic analysis in oat, including one for the diploid oat cross A. atlantica Baum et Fedak x A. hirtula Lag. (AH) (O’Donoughue et al. 1992; Van Deyzne et al. 1995) and one for the hexaploid oat cross A. byzantina C. Koch ‘Kanota’ x A. sativa L. ‘Ogle’ (KO) (Wight et al. 2003). Both of these maps are integrated with the international grass databases Gramene (http://www.gramene.org; Ware et al. 2002) and Graingenes (http://wheat.pw.usda.gov/GG2/index.shtml), where queries and tools are available to facilitate comparative mapping among related species and genera. The objectives of this study were to identify genomic regions in diploid oat suspected to contain genes and QTL that are orthologous to those affecting aluminium tolerance in other grass species, and to use this information to identify genetic markers linked to QTL affecting aluminium tolerance in diploid oat. Materials and Methods Figure 1.Example of comparative mapping study results illustrating the relationships between AH group F and aluminium tolerance-related genes and/or QTL regions located on wheat, barley, rye, maize, and rice chromosomes. The QTL located on rice chromosome 12 in three different populations were related to AH group F through the use of a bridging map; the maize chromosome 10 and rice chromosome 3 maps are composites. References for maps taken directly from the literature include: Miftahudin, et al. (2002) Theor Appl Genet 104:626-631; Nguyen VT, et al. (2002) Molec Genet Genom 267:772-780; Nguyen VT, et al. (2001) Theor Appl Genet 102:1002-1010; Raman H, et al. (2003) Aus J Agric Res 54:1315-1321; Raman H, et al. (2002) Theor Appl Genet 105:458-464; Riede CR and Anderson JA (1996) Crop Sci 36:905-909; Tang Y, et al. (2000) Crop Sci 40:778-782; and Wu P, et al. (2000) Theor Appl Genet 100:1295-1303. A cross (LAG-211) was made between the A. strigosa Schreb. lines CIav 2921 (Al-sensitive) and CIav 9011 (Al-tolerant). Eighty-eight recombinant inbred lines were established by single seed descent to the F6 generation. Each RI line was screened for aluminium tolerance using a hydroponic system, with sixteen seedlings grown in the presence of 300 uM aluminium, and sixteen more grown as aluminium-free controls. After 14 days of growth, the root lengths of the ten seedlings with the longest roots from each treatment were averaged and compared. An extensive literature review and database search was conducted to identify regions conferring aluminium tolerance across grass species. Potentially orthologous regions in diploid oat were identified by comparative mapping, using bridging maps when common markers were not available. Large scale DNA purification, restriction digestion, Southern blotting, and RFLP analysis were performed as described in Wight et al. (2003). AFLP analysis was performed as described in De Koeyer et al. (2004). The SCAR (sequence-characterized amplified region) marker SCA08 developed by Gallego et al. (1998) to mark aluminium tolerance in rye was mapped using standard PCR conditions and an annealing temperature of 50C. Amplified fragments were visualized in 1.8% agarose gels. In addition, primers were developed from a consensus calreticulin candidate gene sequence (calretB1L, 5’- GAAAAGGAGCGAAGGGAAAG-3’; calretB3R, 5’- CAATCCATGGGATCTTCCAT-3’). In the case of this SCAR, an annealing temperature of 52C was used. Molecular mapping was performed using the programs “GMendel” (Holloway and Knapp, 1993) and “Mapmaker v. 3.0” (Lander et al. 1987) as described in Wight et al. (2003). QTL were detected by simple interval mapping using the program “MQTL” (Tinker and Mather 1995). Results and Discussion The distribution of relative root lengths in the LAG-211 population described an approximately normal curve, suggesting that the aluminium tolerance trait in A. strigosa is controlled by more than one gene and/or is strongly affected by environment. An example of how the AH diploid oat reference map was used for the selection of regions to screen for aluminium tolerance QTL in LAG-211 is shown in Figure 1. In this case, it can be seen that the single genes identified in the Triticeae, as well as QTL regions on rice chromosomes 3 and 12 and maize chromosome 10, all show homology with a small segment of AH group F. The molecular marker map generated for the LAG-211 population is presented in Figure 2. Of the 70 RFLP clones tested, eighteen identified polymorphisms in this cross, representing nine of eleven potential QTL regions. The AFLP markers were used to provide additional coverage of the genome, and 41 of these loci were mapped across the genome. Both of the SCAR markers, SCA08 and calretB1_3, mapped to LAG-211 group 1. Four QTL were found using simple interval mapping (Figure 2). The QTL with the largest effect was associated with LAG-211 group 1, containing the AH group F-related marker bcd1250 as well as both SCAR markers. This suggests that the AH group F region of diploid oat surveyed contains a gene that is orthologous to the major aluminium tolerance genes found in wheat, rye, barley, and perhaps maize, as well as a minor QTL in rice. It is also intriguing that the calretB1_3 marker is so closely linked to the major QTL in diploid oat, although the current study provides no direct evidence for the involvement of calreticulin in conferring aluminium tolerance in this species. A second QTL was associated with LAG-211 group 10, which contains the AH group A markers cdo393 and cdo1173. The marker cdo1173 is duplicated on AH group A. While it can be associated with the Alm2 gene found on maize chromosome 6 (data not shown), the peak marker for the QTL on LAG-211 group 10 was cdo393, and this marker is located at the opposite end of the chromosome from cdo1173 on maize chromosome 6. It is well known that translocations and other cytogenetic phenomena exist among and within different cereal species, so we can speculate that the QTL associated with LAG-211 group 10 is orthologous to the Alm2 gene, but only with caution. The two remaining QTL were associated with unlinked AFLP markers. Together, the four QTL accounted for 55% of the total phenotypic variation in aluminium tolerance. The tolerant parent, CIav9011, contributed the positive allele in each case. No significant epistasis was detected among these QTL, or between these QTL and other genomic regions. Figure 3 presents the results obtained when the SCAR markers SCA08 and calretB1_3 were tested across hexaploid oat germplasm. The calretB1_3 band associated with aluminium tolerance was present in twelve hexaploid oat lines tested (Fig. 3A, ten lines not shown), while the SCA08 band was missing (Fig.3B). Thus, the SCA08 marker should prove useful for breeders wanting to introgress the major gene for aluminium tolerance from A. strigosa CIav9011 into elite, hexaploid oat germplasm. This work has demonstrated the effectiveness of using different types of information from different species to identify the locations of genes for a complex trait in a diploid oat population previously uncharacterized by molecular mapping. Figure 2.Molecular marker map of the LAG-211 A. strigosa population with aluminium-tolerance QTL positions highlighted. The percentages given represent the percent phenotype explained by each QTL individually. References Figure 3.Presence of SCAR marker bands in hexaploid oats (panel A=calretB1_3, panel B=SCA08). The bands linked to aluminium tolerance are highlighted. K and O contain DNA from the hexaploid oat varieties Kanota and Ogle. CIav2921 is the aluminium sensitive A. strigosa parent, and CIav9011 is the tolerant parent. Unnamed lanes contain DNA from ten other hexaploid oat varieties or breeding lines. De Koeyer DL, et al. (2004) A molecular linkage map with associated QTLs from a hulless x covered spring oat population.Theor Appl Genet 108:1285-1298 Gallego FJ, et al. (1998) Chromosomal location of PCR fragments as a source of DNA markers linked to aluminium tolerance genes in rye.Theor Appl Genet 96:426-434 Holloway JL and Knapp SJ (1993) G-MENDEL 3.0: Software for the analysis of genetic markers and maps. Oregon State University, Corvallis, pp 1-130 Lander E, et al. (1987) MAPMAKER: An interactive computer package for constructing primary genetic linkage maps of experimental and natural populations.Genomics 1:174-181 O’Donoughue LS, et al. (1992) An RFLP-based linkage map of oats based on a cross between two diploid taxa (Avena atlantica x A. hirtula).Genome 35:765- 771 Tinker NA and Mather DE (1995) MQTL: software for simplified composite interval mapping of QTL in multiple environments.J Agric Genomics 1.Full text available from http://www.cabi-publishing.org/JAG Van Deynze AE, et al.(1995) Comparative mapping in grasses. Oat relationships. Mol Gen Genet 249:349-356 Ware DH, et al. (2002) Gramene, a tool for grass genomics.Plant Physiol 130:1606-1613 Wight CP, et al. (2003) A molecular marker map in Kanota x Ogle hexaploid oat (Avena spp.) enhanced by additional markers and a robust framework.Genome 46:28-47 Acknowledgements This research was made possible by generous financial support from the Quaker Oats Company (USA), Quaker Tropicana Gatorade (Canada), and the Agriculture and Agri-Food Canada Matching Investment Initiative. Our thanks for excellent technical assistance go to Don Beauchesne, Linda Vandermaar, Stefan Halisky, Zachary Fouchard, and Ana Beatriz Locatelli.
![>> W1=[1 1 1 1;1 -j -1 j;1 -1 1 -1;1 j -1 -j] W1 =](https://cdn1.slideserve.com/3227081/slide1-dt.jpg)