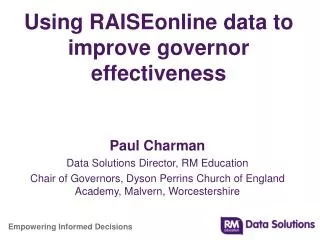
Using RAISEonline to improve our schools
560 likes | 697 Vues
This workshop aims to empower school governors by deepening their understanding of RAISEonline data. Participants will explore key concepts, improve data interpretation skills, and learn how to leverage data for effective school improvement discussions. Emphasis will be placed on the role of data in self-evaluation and accountability, aligning with Ofsted expectations. By enhancing governance practices through data-driven insights, governors can better monitor pupil progress, challenge leadership, and ensure aspirational targets are set for school performance.

Using RAISEonline to improve our schools
E N D
Presentation Transcript
Using RAISEonline to improve our schools Primary 1
Purpose of the day To develop governors’: • knowledge of the data available to them from RAISEonline • understanding key terms and concepts used in RAISEonline • skills in the interpretation of key data • awareness of how RAISEonline can be used to ask challenging questions about the performance of their school • understanding of the contribution of RAISEonline to school self-evaluation and school improvement • understanding of the use of RAISEonline by governors and the protocols that they should follow
Using data to drive improvement It is data that will challenge thinking and stimulate discussion leading to improved practice. It is data that enables progress to be monitored. Christine Gilbert, former Chief Inspector of Schools, 2012
Ofsted’s expectations • ‘Inspectors will expect governors to know about the strengths and weaknesses of the school. Inspectors will expect school governors to be familiar with, and understand, performance data, including the information that the school data dashboard presents for their school ‘(para 55) • ‘The effectiveness of governance including how well governorsprovide challenge and hold the headteacher and other senior leaders to account for improving the quality of teaching, pupils’ achievement and pupils’ behaviour and safety, including by using the data dashboard, other progress data, examination outcomes and test results’ (para 135) • ‘The effectiveness of monitoring and evaluation and the extent to which it is shared with governors – this includes monitoring and evaluation of: the quality of teaching and the achievement and progress of all groups of pupils, including those for those for whom the pupil premium provides support, relative to other schools nationally Ofsted, School Inspection Handbook, 2013
Why should governors use data? • School self-evaluation – to understand strengths and areas for development • School accountability – headteacher and leadership team • Preparation for external inspection and accountability • Ensuring school is setting challenging and aspirational targets for the future (pupils, cohort and school) • Monitoring progress of pupils and cohorts in the school • Developing a vision and strategic direction • Performance managing the headteacher • Determining the allocation of resources: for example, Pupil Premium
Useful data answers or raises important questions • How do attainment and progress at my school compare with national averages and the government’s floor standards? • Do we have any underperforming groups of pupils, or are there wide gaps in attainment between some groups of pupils? • How might the context of our school affect our performance? • Are we relatively stronger or weaker in some subjects compared to others? • How does pupil attendance compare with national averages? Questions suggested by the National Governors’ Association
Use and abuse of data Some data: prisoners The minimum cell space allocation for each prisoner to avoid torture or degrading treatment (as recommended by the Council of Europe European Committee for the Prevention of Torture and Inhuman or Degrading Treatment or Punishment). 8.5m² Some data: students The teaching space allocation for a secondary school student (according to the government’s non-statutory guidance used for school design), based on a 1,000-student school). 4m²
Conclusion? • Prisoners are twice as big as children? • We care less about children than prisoners? • We have more money to spend on prisons than schools? • Prisoners’ needs are greater than children’s needs?
Quick quiz • What is the difference between attainment, progress and achievement? • What is the national average expectation for a child at Key Stage 1? At Key Stage 2? • What does VA stand for and what does it mean? • What progress should children make? • What does RAISE stand for? • What is the difference between an estimate, a target and a prediction? • When are data differences ‘significant’?
RAISEonline • Reporting and • Analysis for • Improvement through • School • Self-Evaluation • Primarily a tool for reporting prior outcomes
RAISEonline: Key processes • RAISEonline makes use of the existing data collected nationally • From schools through the census • From the testing agencies (KS2) • From the examination boards (KS4) • This data is matched together using the Unique Pupil Number (UPN) • The initial set of data is referred to as the unamended data • RAISEonline is first released with unamended data • Primary age 6 phonics KS1 and KS2 data in October • Secondary KS4 data in November/December • After the school’s checking exercise a second set of validated data is produced • The validated data is used to construct the Performance Tables • RAISEonline has a second release in the new year with validated data
Establishing protocols 1. The National Governors Association would not expect all governors to want on-line access, but each governing body should nominate a couple of governors to have access as a minimum. 2. Each year in the autumn term, the school’s RAISE Summary Report should be presented by a member of the school leadership team to a full Governing Body meeting. 3. The governing body must decide how it will consider and analyse the more detailed data, and may set up a committee to consider this or ensure the monitoring of school performance data is within the remit of another committee, such as curriculum committee. Knowing your school: RAISEonline for Governors of Primary Schools, NGA, 2011
Key Understanding 1: Significance Pg33 ‘significant’ indicates an outcome either above or below the average (statistical significance) which we are confident is not the result of chance.
39 points – Level 6 33 points – Level 5 27 points – Level 4 21 points – Level 3 15 points – Level 2 9 points – Level 1 Sublevels 17 points – Level 2A 15 points – Level 2B 13 points – level 2C Test time! How many points is 4A? If a group of pupils have a points score of 19.3 this is roughly what level? Note that a change of 6 points represents a whole level change Note that a change of 2 points represent a sublevel change Key Understanding 2: point scores
Point scores Pg33 ‘significant’ indicates an outcome either above or below the average (statistical significance) which we are confident is not the result of chance.
Key Understanding 4: Always check your sample size • From 1–5 too small • Below 10? • 10 –20 use caution Although over a number of years a consistent pattern could be revealing.
Attainment Threshold measures These are most useful for answering the question “what proportion of pupils have reached this standard?” Point scores These are most useful for answering the question “what is the overall attainment of all pupils?” Progress Expected progress/More than expected progress This is useful for answering questions like “what proportion of pupils have made two (or more) whole levels of progress from KS1 to 2 in reading, writing and maths” Value Added This is most useful for answering the question “how does the overall progress of pupils compare with national progress for children with similar prior attainment?” Key Understanding 5: Types of indicator
How might our school context affect our pupils’ performance? Page 7
School context Page 8
Attendance and exclusion data Page 11
Prior attainment What level had pupils reached when they began Key Stage 2? Page 13
Attainment: Primary school floor standards For tests taken in 2013 mainstream and special schools will be below the floor standard if: • fewer than 60 per cent of its pupils do not achieve Level 4 or above in reading, writing and maths, and • it is below the England median for progression by two levels in reading (91%), in writing (95%), and in maths (92%). For tests taken in 2014 schools will be below the floor standard if: • fewer than 65 per cent of its pupils do not achieve Level 4 or above in reading, writing and maths, and • it is below the England median for progression by two levels in reading, in writing, and in maths.
Attainment Data • Thresholds • “what proportion of pupils have reached this standard?”
Attainment: Achieving level 4 or above Page 26-28
Attainment Data • Average Point Score • “what is the overall attainment of all pupils?”
Attainment: Average points score Page 33
Attainment: Average points score Page 34-35
Progress Data • Expected/more than expected progress • “what proportion of pupils have made two (or more) whole levels of progress from KS1 to 2 in reading, writing and maths?”
What % of each group made the expected rate of progress? Page 47-49
Progress Data • Value Added • “how does the overall progress of pupils compare with national progress for children with similar prior attainment?”
Value added in RAISEonline Page 39-40
Are we closing the gaps with Pupil Premium? Case studies of individual pupils, particularly the lowest attaining pupils and those for whom the pupil premium provides support Guidance to Ofsted inspectors on sources of evidence for pupil progress The learning, quality of work and progress of groups of pupils, particularly those who are disabled, those who have special educational needs and those for whom the pupil premium provides support, show that they achieve exceptionally well. Guidance to Ofsted inspectors on the descriptor for ‘outstanding’ gradeOfsted, School Inspection Handbook, 2012:32
National gaps 2012 Source: Department for Education, Data, research and statistics ‘Struggling primary schools which fail to close gap will have to draw up pupil premium action plans’, D Laws, 5/03/2013
Are we closing the gaps? Page 50-57
What other data would we like? • Pupil attitudes? • Engagement in community activities? • Participation in sport? • Behaviour?
‘Focus on the pig’ There’s a saying in Illinois I learned when I was down in a lot of rural communities. They said, “Just weighing a pig doesn’t fatten it.” You can weigh it all the time, but it’s not making the hog fatter. Barack Obama, 2009