SlideServe
Menu
Préférences
© SlideServe · v2026
Fred H Hutchison

Fred H Hutchison

@fredh
United States

8 Contenus publiés

9 Logical framework to structure the EDPRS PPT
Logical framework to structure the EDPRS

Logical framework to structure the EDPRS. A quick overview. General format of Logframe. Logical framework to structure the EDPRS. One overall logframe for Growth and Poverty Reduction This logframe will provide the context in which sectoral logframes will be developed.

139 vues
16 EXAMPLE  1 PPS
EXAMPLE 1

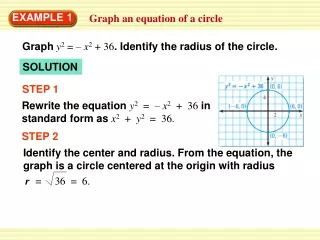
Identify the center and radius. From the equation, the graph is a circle centered at the origin with radius. r = 36 = 6. EXAMPLE 1. Graph an equation of a circle. Graph y 2 = – x 2 + 36 . Identify the radius of the circle. SOLUTION. STEP 1.

183 vues
25 State Board Modeling Needs and Interests PPT
State Board Modeling Needs and Interests

Eric Berntsen, PH, CPESC, CPSWQ State Water Resources Control Board CWEMF Hydrology and Watershed Modeling Workshop June 22, 2007. State Board Modeling Needs and Interests. State Board Modeling Needs and Interests. •Quick Overview of Event-Based and Continuous Simulation Modeling

285 vues
12 California  	   Standards PPT
California Standards

California Standards. NS2.4 Determine the least common multiple and the greatest common divisor of whole numbers; use them to solve problems with fractions (e.g. to find a common denominator to add two fractions or to find the reduced form of a fraction). Vocabulary. multiple

164 vues
48 Big Data is a Big Deal! PPTX
Big Data is a Big Deal!

Big Data is a Big Deal!. Our Team. SUSHANT AHUJA Project Lead Algorithm Design Lead. CASSIO CRISTOVAO Technical Lead Website Architect. SAMEEP MOHTA Documentation Lead Testing Lead. Contents. 1. Project Overview Project Background Our Goal Project Goals Project Technologies

508 vues
31 Creating Figures PPTX
Creating Figures

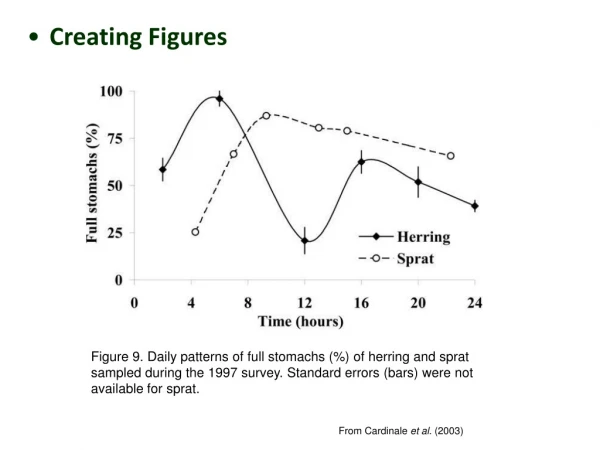
Creating Figures. Figure 9. Daily patterns of full stomachs (%) of herring and sprat sampled during the 1997 survey. Standard errors (bars) were not available for sprat. From Cardinale et al . (2003). When to use figures vs. tables vs. text?.

353 vues