
Creating Figures
E N D
Presentation Transcript
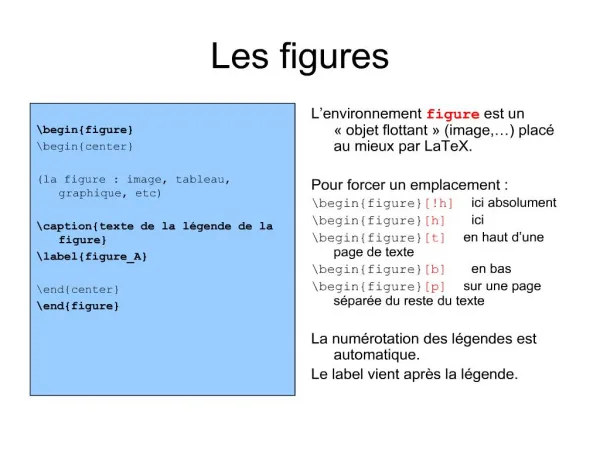
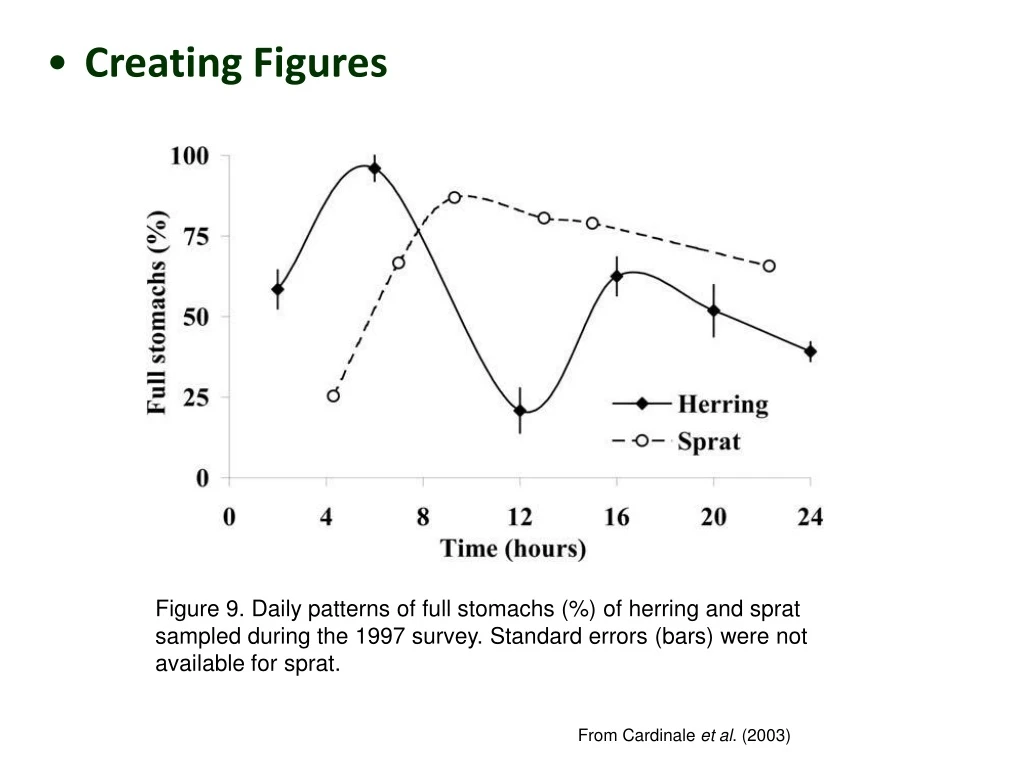
Creating Figures • Figure 9. Daily patterns of full stomachs (%) of herring and sprat sampled during the 1997 survey. Standard errors (bars) were not available for sprat. • From Cardinale et al. (2003)
When to use figures vs. tables vs. text? t (time) - 150', T (temperature) = 32C; t = 0', T = 25C; t = 6',T = 29C; t = 3', T= 27C; t=12’, T = 32C; t = 9',T = 31C temperature (C) time (min) 32 150 27 3 31 9 29 6 25 0 32 12 example from Gopen and Swan 1990
When to use figures vs. tables vs. text? t (time) - 150', T (temperature) = 32C; t = 0', T = 25C; t = 6',T = 29C; t = 3', T= 27C; t=12’, T = 32C; t = 9',T = 31C temperature (C) time (min) 25 0 27 3 29 6 31 9 32 12 32 150
When to use figures vs. tables vs. text? t (time) - 150', T (temperature) = 32C; t = 0', T = 25C; t = 6',T = 29C; t = 3', T= 27C; t=12’, T = 32C; t = 9',T = 31C time (min) temperature (C) 0 25 3 27 6 29 9 31 12 32 150 32
When to use figures vs. tables vs. text? t (time) - 150', T (temperature) = 32C; t = 0', T = 25C; t = 6',T = 29C; t = 3', T= 27C; t=12’, T = 32C; t = 9',T = 31C time (min) temperature (C) 0 25 3 27 6 29 9 31 12 32 150 32
When to use figures vs. tables? • General rules of thumb: • < 4 numbers, state them in the text • Tables are used to report data,figures are used to look at relationships and patterns
When to use figures vs. tables? • Figures - present complex data patterns, when visual is more intuitive than numbers, many data points • Easy to describe in text; figure not necessary • More difficult to describe in text; figure is instructive • 10˚ C • 4˚ C • Cod growth rate • (mm/yr) • Cod growth rate • (mm/yr) • South • North • South • North • Tables – convey essential info that does not fit into text easily (e.g., lat/lon of multiple sites, model parameters), data of interest to others (e.g., model coefficients)
Numbering – tables and figures each numbered in order of citation in text (each start at Table 1 and Figure 1)
The purpose of figures • To present your data in an informative summary • To visualize your data – look for relationships, trends, outliers • To maximize information transfer and minimize ‘clutter’
Minimize wasted space (e.g., origin does not need to be zero) • All elements on graph should convey information (e.g., avoid grid lines)
Creating figures (bad vs good) • Fish Growth • Outside frame, border around graph • No legend for data points, red-green color blindness • Gridlines present, axes lines are grey • Fonts are too small, inappropriate decimal places • No units on axes labels • Figure title • Take-home lesson – Excel does not provide a good graph format, you have to do it yourself • MUCH BETTER!
Effective captions are important for figures and tables • Provide context • Allow figure/table to stand on its own • Complete sentences • NO titles on figures! • Figure - weight of fish of different ages • Figure 1. Mass-at-age of walleye captured between 2002 and 2003 from lakes with stunted- and trophy-sized individuals. Why aren’t the dots connected with a line?
Basic Rules • Independent variable (the one you control) is the x-axis; dependent (or response) variable is the y-axis • The type of data determines the type of graph, e.g.: • Time-series – usually a line graph • Two independent variables – x-y (scatterplot) • Percentages – pie-chart • Categorical independent variable – bar chart
Basic Rules • Graphs do not have titles (except in talks) – they have a heading, below the graph
Basic Rules • Graphs do not have titles (except in talks) – they have a heading, below the graph • Label the axes. Put units of measure on the axes (yrs, mm, percentage, etc.)
Pie charts compare components of a whole sample Madenjian et al. 2006
Addition of years next to each data point aided in data interpretation (years that did not fit the curve were El Nino events that changed the stock-recruit dynamic of the pollock) • Bering Sea pollock • B. A. Megrey and V. G. Wespestad
Comparison of treatments (dependent vs. independent variables)
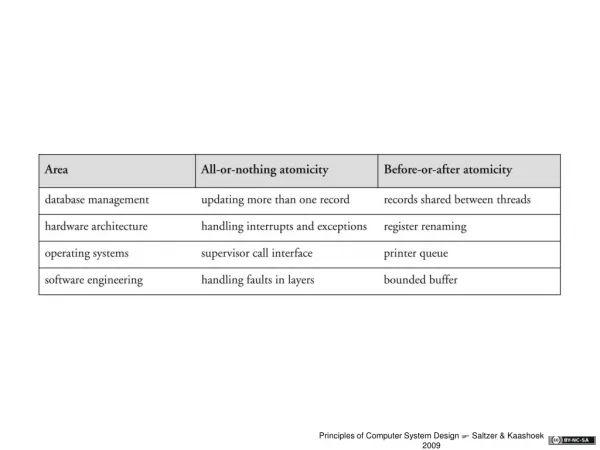
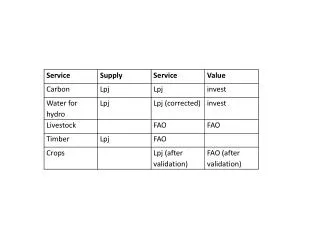
Creating Tables • Table 1. The size range and sample size of each fish species (with prey in stomachs) used in the 2005 (lakewide) and 2006 (western Lake Superior; WLS) selectivity analysis. “na” = not available. • From Isaac et al. (2012) • 24/10
Creating Tables • Table 1. The size range and sample size of smelt with prey in stomachs used in the 2005 (lakewide) and 2006 (western Lake Superior; WLS) selectivity analysis. • These data do not justify a table. • From Isaac et al. (2012) • 25/10
Creating tables • Bluegill • 142 • 14 • 29 • Yellow perch • 203 • 29 • 37 • Smallmouth bass • Juveniles • 157 • 19 • 31 • Adults • 423 • 339 • 18 • Northern pike • Juveniles • 278 • 21 • 14 • Adults • 613 • 638 • 8 • # fish • Mean • length • Mean • mass • Species/life-stage
Creating tables • Bounded by thicker borders on top and bottom • Bluegill • 142 (± 42.3) • 14 (± 2.7) • 29 • Yellow perch • 203 (± 52.9) • 29 (± 3.6) • 37 • Smallmouth bass • Thinner border to set column headers apart from data • Juveniles • 157 (± 22.7) • 19 (± 1.2) • 31 • Adults • 423 (± 62.1) • 339 (± 32.5) • 18 • Northern pike • Juveniles • 278 (± 48.2) • 21 (± 3.3) • 14 • Adults • 613 (± 77.3) • 638 (± 62.7) • 8 • Mean • length (mm) • Mean • mass (g) • Species/life-stage • n • 27/10
Creating tables • Clearly labeled column headers, with units, “n” is universal for “sample size” • Bounded by thicker borders on top and bottom • Bluegill • 142 (± 42.3) • 14 (± 2.7) • 29 • Yellow perch • 203 (± 52.9) • 29 (± 3.6) • 37 • Smallmouth bass • Thinner border to set column headers apart from data • Juveniles • 157 (± 22.7) • 19 (± 1.2) • 31 • Adults • 423 (± 62.1) • 339 (± 32.5) • 18 • Northern pike • Juveniles • 278 (± 48.2) • 21 (± 3.3) • 14 • Adults • 613 (± 77.3) • 638 (± 62.7) • 8 • Mean • length (mm) • Mean • mass (g) • Species/life-stage • n • Measure of variance, when appropriate • No borders separating columns or rows of data • 28/10
Creating tables • Bluegill • 142 (± 42.3) • 14 (± 2.7) • 29 • Yellow perch • 203 (± 52.9) • 29 (± 3.6) • 37 • Smallmouth bass • Juveniles • 157 (± 22.7) • 19 (± 1.2) • 31 • Adults • 423 (± 62.1) • 339 (± 32.5) • 18 • Northern pike • All numbers are right-aligned in columns • Juveniles • 278 (± 48.2) • 21 (± 3.3) • 14 • Adults • 613 (± 77.3) • 638 (± 62.7) • 8 • Mean • length (mm) • Mean • mass (g) • Species/life-stage • n • 29/10
Creating tables • Table 1. Mean lengths and mass of four fish species sampled in Lost Lake in 2015. Standard deviations are shown in parentheses. • Caption that identifies the types of data in the table, with time and place where they were collected. • Bluegill • 142 (± 42.3) • 14 (± 2.7) • 29 • Yellow perch • 203 (± 52.9) • 29 (± 3.6) • 37 • Smallmouth bass • Juveniles • 157 (± 22.7) • 19 (± 1.2) • 31 • Adults • 423 (± 62.1) • 339 (± 32.5) • 18 • Northern pike • Juveniles • 278 (± 48.2) • 21 (± 3.3) • 14 • Adults • 613 (± 77.3) • 638 (± 62.7) • 8 • Mean • length (mm) • Mean • mass (g) • Species/life-stage • n
Use of multiple underlines to link and clarify headings • Table 1. The size range and sample size of each fish species (with prey in stomachs) used in the 2005 (lakewide) and 2006 (western Lake Superior; WLS) selectivity analysis. “na” = not available. • From Isaac et al. (2012)