Download
1 / 19
190 likes | 209 Vues
Explore the effects of two factors using a two-way ANOVA analysis to comprehend interactions and main effects. Learn how to handle interactions, interpret results, and leverage covariates to enhance analysis outcomes.

E N D
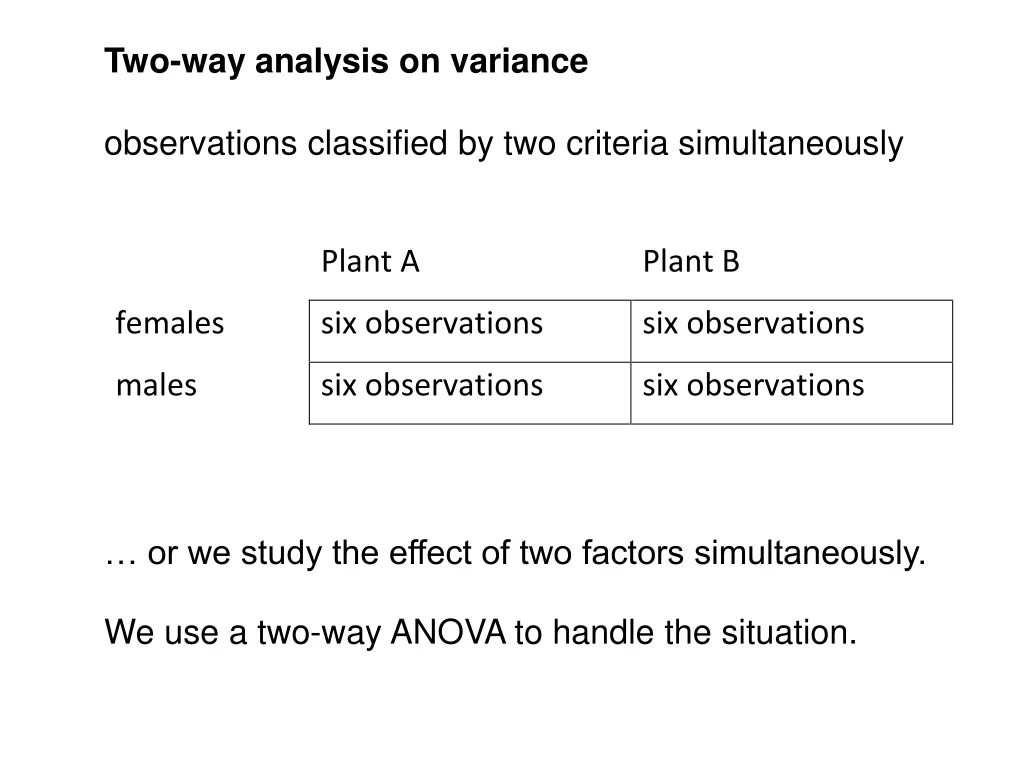
Two-way analysis on variance observations classified by two criteria simultaneously … or we study the effect of two factors simultaneously. We use a two-way ANOVA to handle the situation.
Dependent Variable: kaal Sum of Source DF Squares Mean Square F Value Pr > F Model 2 41.63200000 20.81600000 33.68 <.0001 Error 17 10.50600000 0.61800000 Corrected Total 19 52.13800000 R-Square Coeff Var Root MSE kaal Mean 0.798496 13.12404 0.786130 5.990000 Source DF Type III SS Mean Square F Value Pr > F taim 1 20.00000000 20.00000000 32.36 <.0001 sugu 1 21.63200000 21.63200000 35.00 <.0001 Results are presented as an ANOVA table _________________________________ effect df SS F p _________________________________ plant 1 20.0 32.3 <0.0001 sex 1 21.6 35.0 <0.0001 error 17 10.5
_________________________________ effect df SS F p _________________________________ plant 1 20.0 32.3 <0.0001 sex 1 21.6 35.0 <0.0001 error 17 10.5 _________________________________ because MS=SS/df, no need to report R2 = SSeffect/SStotal iga efekti kohta eraldi Or as a sentence: “the effect of host plant on pupal weight was statistically confirmed (F1,17=32.3, p<0.0001; two-way ANOVA with sex as an additional factor).“ ... are not the same as for one-way ANOVA, no dependent variable, no direction separately for each factor
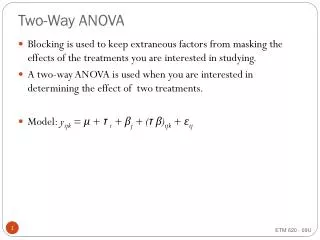
interaction – the effect of one factor depends on the level of another factor, There is an interaction in these data: parallel lines, with a change in the direction or not, symmetric Source DF SS MS F P plant 1 0.05 0.05 0.08 0.77 sex 1 79.20 79.20 131.24 <.0001 plant*sex 1 20.00 20.00 33.14 <.0001
_________________________________________ effect df SS F p _________________________________________ plant 1 0,05 0,08 0,8 sex 1 79,2 131,2 <0.0001 plant*sex 1 20,0 33,1 <0.0001 error 16 9,7 _________________________________________ There is no interaction when the effects are additive. Logarithmic transformation turns the model to multiplicative! In the case of interaction, there may be main effects but need not be. Be careful!
Fill in the blank so that there is no interaction male on birch 50 mg female on birch 80 mg male on alder 70 mg female on alder ..... mg
Fill in the blank so that there were an interaction „with a change in the direction“ crocodile in the sea 8 m crocodile in a lake 6 m snake in the sea 9 m snake in a lake ..... m
Fill in the blank so that there is no interaction male on birch 50 mg female on birch 80 mg male on alder 70 mg female on alder 100 mg male on willow 100 mg female on willow .... mg
Fill in the blank so that there is no interaction male on birch 50 mg female on birch 80 mg male on alder 70 mg female on alder 80 mg male on willow 100 mg female on willow .... mg
Fill in the blank so that there is no interaction after logarithmic transformation: male on birch 50 mg female on birch 100 mg male on alder 80 mg female on alder ..... mg
Fill in the blank so that there is no main effect of tree species: male on birch 50 mg female on birch 80 mg male on alder 70 mg female on alder ..... mg
Fill in the blank so that there is no main effect of either of the factors: male on birch 50 mg female on birch 80 mg male on alder .... mg female on alder ..... mg
Source DF Type III SS Mean Square F Value Pr > F taim 1 5.0041161 5.0041161 4.83 0.0293 sugu 1 609.9239388 609.9239388 588.16 <.0001 taim*sugu 1 159.7450216 159.7450216 154.05 <.0001 varv 1 6.6006350 6.6006350 6.37 0.0125 taim*varv 1 12.8614007 12.8614007 12.40 0.0005 sugu*varv 1 0.1566191 0.1566191 0.15 0.6980 taim*sugu*varv 1 0.0470915 0.0470915 0.05 0.8315 auk 1 0.3428916 0.3428916 0.33 0.5660 taim*auk 1 0.5017713 0.5017713 0.48 0.4876 sugu*auk 1 2.2543296 2.2543296 2.17 0.1421 taim*sugu*auk 1 0.0663268 0.0663268 0.06 0.8006 varv*auk 1 0.7646613 0.7646613 0.74 0.3916 taim*varv*auk 1 3.4534288 3.4534288 3.33 0.0696 sugu*varv*auk 1 3.4380134 3.4380134 3.32 0.0703 taim*sugu*varv*auk 1 0.0000439 0.0000439 0.00 0.9948 It is well possible to have a more than two-way ANOVA, it will be complicated with interactions : An interaction between three factors – the natuure of a the two-way interaction depends on the level of the third factor.
Regressionanlysis is based on the same principles - can be combined: covariate, analysis of covariance (ANCOVA), does not really matter whether the independent variables is continuous or categorical! We will present in the same way, df of the covariate always 1. Often just to eliminate a confounding effect!
control egg size with snails weight of the mother With the covariate included: p = 0.0032 the covariate itself: p < 0.0001 egg size p = 0.10
Why does it help to find the difference? F=MSmodel/MSerror – covariate reduced error variance! You can add any number of covariates but: - too many reduce the power of the test - will not include if non-significant – unless we know in advance - ethical problem – playing with the model we can get what we want by chance; - if depends on non-significant covariates – too little data! - backward elimination model simplification procedure The effect of covariate eliminated – LSMEANS.
_________________________________________ effect df SS F p _________________________________________ treatment2 0.05 0.08 0.8 weight 1 79.2 131.2 <0.0001 age 1 20.0 33.1 <0.0001 box age 1 0.3 1.3 0.45 blueberry 1 1.2 1.9 0.23 error 16 9.7 _________________________________________
_________________________________________ effect df SS F p _________________________________________ treatment2 0.04 0.06 0.8 weight 1 80.2 134.2 <0.0001 age 1 17.9 37.1 <0.0001 blueberry 1 1.2 2.9 0.17 error 1710.4 _________________________________________
_________________________________________ effect df SS F p _________________________________________ treatment2 0.06 0.09 0,7 weight 1 84.2 131.2 <0.0001 age 1 20.9 33.1 <0.0001 error 18 12.4 _________________________________________