Download
1 / 10
100 likes | 122 Vues
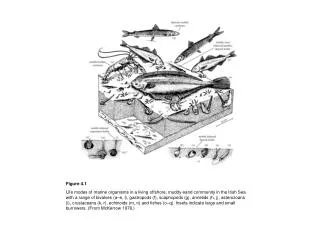
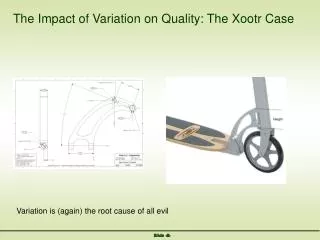
Explore the lifecycle demand trajectory, process layouts, line balancing, cost analysis, and trade-offs in Xootr manufacturing. Enhance efficiency and productivity in high volume production.

E N D
Weekly demand 1400 1200 1000 800 600 400 200 0 Figure 4.2. : Lifecycle demand trajectory for Xooters July May April June March August January October November December September
Components Finished Xootrs Activity 3 Activity 1 Activity 2 Figure 4.3.: Current process layout
Conveyor Belt Components Finished Xootrs Activity 1 Activity 2 Activity 3 Figure 4.4. : A machine paced process lay-out (Note: conveyor belt is only shown for illustration)
Cycle Time Before Line Balancing 900 800 12 700 10 10 11 20 9 9 1: Prepare cable 2: Move cable 3: Assemble washer 4: Apply fork, threading cable end 5: Assemble Socket head screws 6: Steer pin nut 7: Brake shoe, spring, pivot bolt 8: Insert front wheel 9: Insert axle bolt 10: Tighten axle bolt 11: Tighten brake pivot bolt 12: Assemble handle-cap 13: Assemble brake lever + cable 14: Trim and cap cable 15: Place first rib 16: Insert axles and cleats 17: Insert rear wheel 18: Place second rib and deck 19: Apply grip tape 20: Insert deck fasteners 21: Inspect and wipe-off 22: Apply decal and sticker 23: Insert in bag 24: Assemble carton 25: Insert Xootr and manual 26: Seal carton 600 19 8 8 500 18 Activity time [seconds] 7 7 26 400 17 6 25 5 5 300 16 15 24 4 4 23 200 22 14 2 2 3 3 100 13 1 1 21 0 Step 1 Step 2 Step 3 Cycle Time After Line Balancing 900 800 700 26 600 17 25 500 Activity time [seconds] 24 16 15 23 400 6 22 14 300 21 13 20 200 12 19 100 18 11 0 Step 1 Step 2 Step 3 Figure 4.5 : Graphical illustration of Line balance
Step 1 Step 2 Step 3 Components Finished Xootrs Step 1 Step 2 Step 3 Step 1 Step 2 Step 3 Step 1 Step 2 Step 3 Four identical lines using the initial process lay-out, 1 worker per step Components Finished Xootrs 4 workers 4 workers 4 workers Step 1 Step 2 Step 3 Finished Xootrs Components 1 2 3 4 5 6 7 8 9 10 11 12 One line, 1 worker per step; inventory between step not shown Figure 4.6. : Three process lay-outs for high volume production
200 180 160 140 120 100 Activity time [seconds] 80 60 40 20 0 Worker 1 2 3 4 5 6 7 8 9 10 11 12 Figure 4.7 : Line balance in a highly specialized line (different colors represent different tasks)
Step 1 Step 2 Step 3 Components Finished Xootrs Step 1 Step 2 Step 3 Step 1 Step 2 Step 3 Same Person Figure 4.8. : Parallel work cells (only 3 work-cells are shown)
100% Other Overhead 90% Warranty 80% Quality 70% Assembly and other Labor costs 60% 50% Purchasedparts andassemblies Parts andmaterialcosts 40% Logistics costs 30% 20% Material costs 10% 0% Final Assembler’s cost Including Tier 1 Costs Including Tier 2 Costs Rolled-upCosts over ~ 5 Tiers Figure 4.9.: Sources of Cost in the Supply Chain (Whitney 2004, based on DaimlerChrysler)
Labor Productivity (Xooters per employee) Largely automated processlikely to be operated inhigh wage region High labor productivity Improvement becauseof line-balancing High capability frontier Trade-off Low labor productivity Low capabilityfrontier Return on assets (sales per $ of equipment) Low High Figure 4.10.: Trade-off between labor productivity and capital investment Largely manual process, Likely to be operated in low wage region