Chapter 6 Discrete Probability Distributions
Chapter 6 Discrete Probability Distributions. North Seattle Community College BUS210 Business Statistics. Learning Objectives. In this section, you will learn about:. Probability distributions and their properties Important discrete probability distributions: The Binomial Distribution

Chapter 6 Discrete Probability Distributions
E N D
Presentation Transcript
Chapter 6 Discrete Probability Distributions North Seattle Community College BUS210 Business Statistics
Learning Objectives In this section, you will learn about: • Probability distributions and their properties • Important discrete probability distributions: • The Binomial Distribution • The Poisson Distribution • Calculating the expected value and variance • Using the Binomial and Poisson distributions to solve business problems
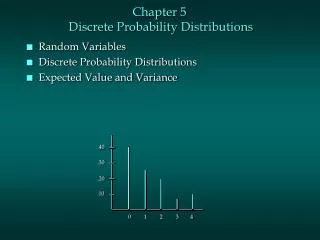
Definitions • Random variable: representation of a possible numerical value from an uncertain event. • Discreterandom variables: “How many” produce outcomes that come from counting (e.g. number of courses you are taking). • Continuousrandom variables: “How much” produce outcomes that come from a measurement (e.g. your annual salary, or your weight).
Random Variables Random Variables Discrete Random Variable Discrete Random Variable Continuous Random Variable Ch. 7 Ch. 6
Discrete Random Variables • Can only assume a countable number of values Examples: • Rolling five dice (as in Yahtzee) If X is the number of times that a 6 shows up, then X could be equal to 0, 1, 2, 3, 4, or 5 • Flipping a coin 3 times. If X is the number of times that heads comes up, then X could be equal to 0, 1, 2, or 3
Discrete Random Variables • A probability distribution is… a mutually exclusive listing of all possible numerical outcomes for a variable and the probability of an occurrence associated with each outcome. • Example for a discrete random variable: Notice that the total probability adds up to 1.00
Discrete Random Variable Probability Distribution Probability Distribution Experiment: Toss 2 Coins. Let X = # heads. T T 4 possible outcomes T H H T H H 0.50 0.25 Probability Total = 1.00 0 1 2 X
Discrete Random Variable Expected Value Expected Value is the mean of a discrete random variable Also known as the Weighted Average • Example:Experiment of 2 Tossed Coins
Discrete Random Variable Measuring Dispersion • Variance of a discrete random variable • Standard Deviation of a discrete random variable
Discrete Random Variable Measuring Dispersion (continued) • Example: standard deviation of 2 tossed coins
Probability Distributions Probability Distributions Discrete Probability Distributions Discrete Probability Distributions Continuous Probability Distributions Binomial Binomial Binomial Normal Exponential Poisson Poisson Ch. 6 Ch. 7
Probability Distributions Binomial • A finite number of observations, n • 20 tosses of a coin • 12 auto batteries purchased from a wholesaler • Each observation is categorized as… • Success: “event of interest”has occurred, or • i.e. - heads (or tails) in each toss of a coin; • i.e. - defective (or not defective) battery • Failure: “event of interest”has not occurred • The complement of a success • These two categories, success & failure, are • mutually exclusive and collectively exhaustive Note: A random experiment with only 2 outcomes is known as a Bernoulli experiment.
Probability Distributions Binomial (continued) • The probability of… • success (event occurring) is represented as π • failure (event not occurring) is 1 – π • Probability of success (π) is constant • Probability of getting tails is the same for each toss of the coin • Observations are independent • Each event is unaffected by any other event • Two sampling methods deliver independence • Infinite population without replacement • Finite population with replacement
Probability Distributions Binomial (continued) • Applications: Situations where are there only two outcomes • Apple marks newly manufactured iPads as either defective or acceptable • Visitors to Amazon’s website will either buy an item or not buy an item. • Asking if voters will approve a referendum, a pollster receives responses of “yes” or “no” • Federal Express marks a delivery as either damaged or not damaged
Probability Distributions Binomial (continued) Counting Revisited: • You toss a coin three times. In how many ways can you get two heads? • Possible ways: HHT, HTH, THH, • so there are three ways you can getting two heads. • This situation is fairly simple….but, what about 10 times?…a 100?...or even a thousand? • For more complicated situations we need a method • to be able to count the number of ways (combinations).
Counting TechniquesRule of Combinations • The number of combinations of selecting x objects out of n objects is where:n! means “n factorial” 2! = (1)(2) 4! = (1)(2)(3)(4) Note: 0! = 1 (by definition)
Counting TechniquesRule of Combinations • You visit Baskin & Robbins. How many different possible 3 scoop combinations could you decide on for your ice cream cone if you select from their 31 flavors? • The total choices is n = 31, and we select x = 3. combinations
Probability Distributions Binomial n! P(x) =π x(1-π) n-x n!(n-x)! π = probability of “event of interest” n = sample size (number of trials or observations) x = number of “events of interest” in sample for the number of heads in 3 coin flips, we would use… π = 0.5 and (1 – π) = 0.5 n = 4 X = can be 0, or 1, or 2, or 3 Each value of X will have a different probability Note: other sources may show this equation as or similar.
Probability Distributions Binomial Example What is the probability of 2 successes in 7 observations if the probability of the event of interest is 0.4? x = 1, n = 7, and π = 0.4
Probability Distributions Binomial Example The probability of a single customer purchasing an extended warranty is 0.35. What is the probability of having 3 of the next 10 customers purchase an extended warranty?
Probability Distributions Using the Binomial Table P(x = 3) = .2522 Examples: n = 10, π = .35, x = 3 n = 10, π = .75, x = 2 P(x = 2) = .0004
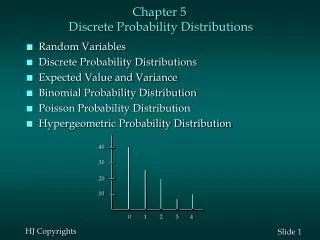
The shape of the binomial distribution… depends on the values of π and n Probability Distributions Shape of the Binomial n = 5 π = 0.5 n = 5 π = 0.1 P(X) P(X) .6 .6 .4 .4 X X .2 .2 0 1 2 3 4 1 5 0 2 3 4 5 0 0
Binomial Distribution Characteristics • Mean • Variance and Standard Deviation Where n = sample size π = probability of the event of interest for any trial (1 – π) = probability of no event of interest for any trial
Binomial Distribution Characteristics Examples n = 5 π = 0.1 P(X) P(X) n = 5 π = 0.5 .6 .6 .4 .4 X X .2 .2 0 1 2 3 4 1 5 0 2 3 4 5 0 0
Binomial Distribution Characteristics Compound Events Individual probabilities can be added to obtain any desired combined event probability. • Examples: • The probability that less than 3 of the next 10 customers will purchase an extended warranty is • The probability that 3 or fewer of the next 10 customers will purchase an extended warranty is
Binomial DistributionUsing Excel Cell Formulas n xπ n xπ x (1-π) x n π cum
Probability Distributions Probability Distributions Discrete Probability Distributions Continuous Probability Distributions Binomial Normal Exponential Poisson Poisson Ch. 6 Ch. 7
Probability Distributions The Poisson Distribution • Used when you are interested in… the number of times an event occurs within a continuous unit or interval. • Such as time, distance, volume, or area. • Examples: The number of… • potholes in mile of road (distance) • computer crashes in a day (time) • chocolate chips in a cookie (volume) • mosquito bites on a person (area) Was actually used in a study of malaria
Probability Distributions The Poisson Distribution • Defining features: • Independent: The occurrence of any single event does not impact the occurrence of any other event. • Constant: The average probability of an event occurring in one area of opportunity remains the same for all other similar areas. The average number of events per unit is represented by (lambda) • The average probability of an event decreases or increases proportionally to any decrease or increase in the size of the area of opportunity.
Probability Distributions The Poisson Distribution e -λλx P(x) = x! where: x = number of events in an area of opportunity = expected value (mean) of number of events e = base of the natural logarithm system (2.71828...) Note: other sources may show this equation as or similar.
Poisson Distribution Characteristics • Mean Isn’t that interesting? • Variance and Standard Deviation where = expected number of events
Probability Distributions Using the Poisson Table Example: Find P(X = 2) if = 0.50
Poisson DistributionUsing Excel Cell Formulas x λ cum
Probability Distributions Graphing the Poisson = 0.50 P(X=2) = 0.0758
Probability Distributions Shape of the Poisson • The shape of the Poisson Distribution depends on the parameter : = 0.50 = 3.00
Chapter Summary • Probability distributions • Discrete random variables • The Binomial distribution • The Poisson distribution