Download

1 / 28
280 likes | 361 Vues
Learn about discrete probability distributions, random variables, and how to calculate probabilities for different outcomes. Explore examples and analyze probability scenarios with charts and histograms.

E N D
Discrete probability distributions 3)For every possible x value, 0 < P(x) < 1. 4) For all values of x, S P(x) = 1.
Think About It… • In a game of dice a friend gives you a choice. If an even number is rolled you win $100, if a 5 is rolled you win $100. Which option would you choose? Why? • You friend now states if a 5 is rolled you will win $200. Which option would you choose? Why? • Again, your friend increased a roll of 5 to $300. • Which option would you choose? Why • Finally your friend states a roll of 5 will win you $400. Which option would you choose? Why?
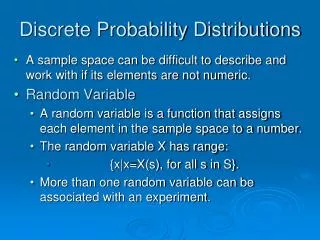
Random Variable - • A numerical variable whose value depends on the outcome of a chance experiment
Two types: • Discrete – count of some random variable • Continuous – measure of some random variable
Random Variable Example: Consider tossing a fair coin 3 times. Define X = the number of heads obtained
Discrete • The probabilities pi must satisfy two requirements: • Every probability piis a number between 0 and 1. • 0 < P(x) < 1. • The sum of the probabilities is 1. • Σ P(x) = 1. • To find the probability of any event, add the probabilities piof the particular values xithat make up the event.
Discrete Probability Distribution • A distribution of a random variable gives its possible values and their probabilities. • Usually displayed in a table, but can be displayed with a histogram or formula
Probability Distribution Example: Consider tossing a fair coin 3 times. Define X = the number of heads obtained Make a Probability Distribution Chart Make a Probability Distribution Histogram
What are the chances • What is P(X > 2) • Show that this is a legitimate probability distribution.
Let x be the number of courses for which a randomly selected student at a certain university is registered. X 1 2 3 4 5 6 7 P(X) .02 .03 .09 ? .40 .16 .05 P(x = 4) = P(x < 4) = P(x < 4) = What is the probability that the student is registered for at least five courses? Why does this not start at zero? .25 .14 P(x > 5) = .61 .39
Example: Babies’ Health at Birth Read the example on page 343. • Show that the probability distribution for X is legitimate. • Make a histogram of the probability distribution. Describe what you see. • Apgar scores of 7 or higher indicate a healthy baby. What is P(X ≥ 7)? (a) All probabilities are between 0 and 1 and they add up to 1. This is a legitimate probability distribution. (c) P(X ≥ 7) = .908 We’d have a 91 % chance of randomly choosing a healthy baby. (b) The left-skewed shape of the distribution suggests a randomly selected newborn will have an Apgar score at the high end of the scale. There is a small chance of getting a baby with a score of 5 or lower.
Formulas for mean & variance Found on formula card!
Dice Expected Value Comparisons
Tebow Time! The NFL Draft is an annual event which is the most common source of player recruitment. In the first round of the 2010 NFL draft the Denver Broncos selected Tim Tebow. At the position of Quarterback Tebow’s ability was highly debated on a national level. The Broncos’ Franchise took a major risk, however, do no think for a second this was not a calculated risk. Imagine you are on the Broncos Management. Judging by his record in College, analysts predict Tebow has a 10% chance of becoming an elite quarterback, pulling in $20 million for the franchise. He has a 40% chance of being average, bringing in $10 million. Otherwise, he will be 2nd or 3rd string which brings in no money and would be a loss (the cost of the contract) of $9.7 million.
Example: Apgar Scores – What’s Typical? Consider the random variable X = Apgar Score Compute the mean of the random variable X and interpret it in context. The mean Apgar score of a randomly selected newborn is 8.128. This is the long-term average Agar score of many, many randomly chosen babies. Note: The expected value does not need to be a possible value of X or an integer! It is a long-term average over many repetitions.
1. A college instructor teaching a large class traditionally gives 10% A’s, 20% B’s, 45% C’s, 15% D’s, and 10% F’s. If a student is chosen at random from the class, the student’s grade on a 4-point scale (A = 4) is a random variable X. Create the probability distribution of X. • What is the probability that a student has a grade point of 3 or better in this class? • Draw a probability histogram to picture the probability distribution of the random variable X. • 2. Put all the letters of the alphabet in a hat. If you choose a consonant, I pay you $1. If you choose a vowel, I pay you $5. X is the random variable representing the outcome of the experiment. • Create the distribution of X • What is your expected payoff (value) in this game? You Try…
2. Put all the letters of the alphabet in a hat. If you choose a consonant, I pay you $1. If you choose a vowel, I pay you $5. X is the random variable representing the outcome of the experiment. • What is the game’s variance? The Standard deviation?
Let x be the number of courses for which a randomly selected student at a certain university is registered. X 1 2 3 4 5 6 7 P(X) .02 .03 .09 .25 .40 .16 .05 What is the expected value and standard deviations of this distribution? m = 4.66 & s = 1.2018
Is the formula the only way?!?!?!?!!? Stat, 1:Edit L1 = Random Variable ( X ) L2 = Probability (pi) Stat, Calc, 1: 1-Var Stats 2nd Stat L1 2nd Stat L2 1-Var Stats L1, L2
Let x be the number of courses for which a randomly selected student at a certain university is registered. X 1 2 3 4 5 6 7 P(X) .02 .03 .09 .25 .40 .16 .05 What is the expected value and standard deviations of this distribution? m = 4.66 & s = 1.2018
Box of 20 DVDs, 4 are defective. Select two from the box without replacement • Identify your random variables. • Create a Probability Distribution • What is the mean (expected value) of the discrete random variable? • What is the variance? The Standard Deviation? .
Cars in a Town • X = number of vehicles owned by a household in a random town • P(0) =.05, P(1) = .45, P(2) = .275, P(3) = .1, P(4) = .075, • P(5) = .05 • Identify your random variables. • Create a Probability Distribution • What is the mean (expected value) of the discrete random variable? • What is the variance? The Standard Deviation?
Book Editor • X = # of errors that appear on a randomly selected page of a book • X = 0, 1, 2, 3 ,4 • P(0) =.73, P(1) = .16, P(2) = .06, P(3) = .04, P(4) = .01 • Identify your random variables. • Create a Probability Distribution • What is the mean (expected value) of the discrete random variable? • What is the variance? The Standard Deviation?
Flights from LA to Chicago • X = # of flights that are on time out of 3 independent flights • P(0) =.064, P(1) = .288, P(2) = .432, P(3) = .216 • Identify your random variables. • Create a Probability Distribution • What is the mean (expected value) of the discrete random variable? • What is the variance? The Standard Deviation?
Linear combinations Just add or subtract the means! If independent, always add the variances!
A nationwide standardized exam consists of a multiple choice section and a free response section. For each section, the mean and standard deviation are reported to be mean SD MC 38 6 FR 30 7 If the test score is computed by adding the multiple choice and free response, then what is the mean and standard deviation of the test? m = 68 & s = 9.2195
If x is a random variable and a and b are numerical constants, then the random variable y is defined by and Linear function of a random variable The mean is changed by addition & multiplication! The standard deviation is ONLY changed by multiplication!
Let x be the number of gallons required to fill a propane tank. Suppose that the mean and standard deviation is 318 gal. and 42 gal., respectively. The company is considering the pricing model of a service charge of $50 plus $1.80 per gallon. Let y be the random variable of the amount billed. What is the mean and standard deviation for the amount billed? m = $622.40 & s = $75.60