Discrete Probability Distributions
This chapter explores binomial experiments, which are probability experiments meeting specific criteria. Each experiment consists of a fixed number of independent trials, with only two outcomes: success or failure. Key notations such as the number of trials (n), probability of success (p), and probability of failure (q) are defined. The binomial probability formula calculates the likelihood of achieving a certain number of successes. Examples illustrate both valid and invalid binomial experiments, along with methods for finding probabilities and graphing distributions.


Discrete Probability Distributions
E N D
Presentation Transcript
Chapter 4 Discrete Probability Distributions
Binomial Distributions § 4.2
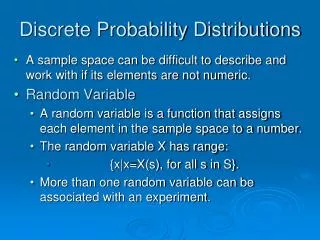
Binomial Experiments A binomial experiment is a probability experiment that satisfies the following conditions. 1. The experiment is repeated for a fixed number of trials, where each trial is independent of other trials. 2. There are only two possible outcomes of interest for each trial. The outcomes can be classified as a success (S) or as a failure (F). 3. The probability of a success P (S) is the same for each trial. 4. The random variable x counts the number of successful trials.
Notation for Binomial Experiments Symbol Description n The number of times a trial is repeated. p = P (S) The probability of success in a single trial. q = P (F) The probability of failure in a single trial. (q = 1 – p) x The random variable represents a count of the number of successes in n trials: x = 0, 1, 2, 3, … , n.
Binomial Experiments Example: Decide whether the experiment is a binomial experiment. If it is, specify the values of n, p, and q, and list the possible values of the random variable x. If it is not a binomial experiment, explain why. • You randomly select a card from a deck of cards, and note if the card is an Ace. You then put the card back and repeat this process 8 times. This is a binomial experiment. Each of the 8 selections represent an independent trial because the card is replaced before the next one is drawn. There are only two possible outcomes: either the card is an Ace or not.
Binomial Experiments Example: Decide whether the experiment is a binomial experiment. If it is, specify the values of n, p, and q, and list the possible values of the random variable x. If it is not a binomial experiment, explain why. • You roll a die 10 times and note the number the die lands on. This is not a binomial experiment. While each trial (roll) is independent, there are more than two possible outcomes: 1, 2, 3, 4, 5, and 6.
p = the probability of selecting a red chip Binomial Probability Formula In a binomial experiment, the probability of exactly x successes in n trials is Example: A bag contains 10 chips. 3 of the chips are red, 5 of the chips are white, and 2 of the chips are blue. Three chips are selected, with replacement. Find the probability that you select exactly one red chip. q = 1 – p = 0.7 n = 3 x = 1
The binomial probability formula is used to find each probability. p = the probability of selecting a red chip Binomial Probability Distribution Example: A bag contains 10 chips. 3 of the chips are red, 5 of the chips are white, and 2 of the chips are blue. Four chips are selected, with replacement. Create a probability distribution for the number of red chips selected. q = 1 – p = 0.7 n = 4 x = 0, 1, 2, 3, 4
Complement Finding Probabilities Example: The following probability distribution represents the probability of selecting 0, 1, 2, 3, or 4 red chips when 4 chips are selected. a.) Find the probability of selecting no more than 3 red chips. b.) Find the probability of selecting at least 1 red chip. a.) P (no more than 3) = P (x 3) = P (0) + P (1) + P (2) + P (3) = 0.24 + 0.412 + 0.265 + 0.076 = 0.993 b.) P (at least 1) = P (x 1) = 1 – P (0) = 1 – 0.24 = 0.76
P (x) Selecting Red Chips 0.5 Probability 0.4 0.3 0.2 x 0 0.1 Number of red chips 0 2 1 3 4 Graphing Binomial Probabilities Example: The following probability distribution represents the probability of selecting 0, 1, 2, 3, or 4 red chips when 4 chips are selected. Graph the distribution using a histogram.
Mean, Variance and Standard Deviation Population Parameters of a Binomial Distribution Mean: Variance: Standard deviation: Example: One out of 5 students at a local college say that they skip breakfast in the morning. Find the mean, variance and standard deviation if 10 students are randomly selected.