Discrete Probability Distributions
Discrete Probability Distributions. A Random Variable. “x” is determined by chance Or “could be” determined by chance? The important thing: it’s some value we get in a single trial of a probability experiment It’s what we’re measuring. Discrete vs. Continuous. Discrete. Continuous.


Discrete Probability Distributions
E N D
Presentation Transcript
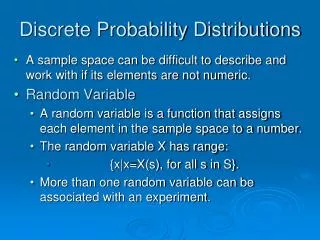
A Random Variable • “x” is determined by chance • Or “could be” determined by chance? • The important thing: it’s some value we get in a single trial of a probability experiment • It’s what we’re measuring
Discrete vs. Continuous Discrete Continuous All real numbers in some interval An age between 10 and 80 (10.000000 and 80.000000) A dollar amount A height or weight • A countable number of values • “Red”, “Yellow”, “Green” • 2 of diamonds, 2 of hearts, … etc. • 1, 2, 3, 4, 5, 6 rolled on a die
Discrete is our focus for now Discrete Continuous Will talk about continuous probability distributions in future chapters. • A countable number of values (outcomes) • “Red”, “Yellow”, “Green” • 2 of diamonds, 2 of hearts, … etc. • 1, 2, 3, 4, 5, 6 rolled on a die
Start with a frequency distribution General layout A specific made-up example
Include a Relative Frequency column General layout A specific simple example
You can drop the count column General layout A specific simple example
Sum MUST BE EXACTLY 1 !!! • In every Probability Distribution, the total of the probabilities must always, every time, without exception, be exactly 1.00000000000. • In some cases, it might be off a hair because of rounding, like 0.999 for example. • If you can maintain exact fractions, this rounding problem won’t happen.
Answer Probability Questions What is the probability … A specific simple example • …that a randomly selected household has exactly 3 children? • …that a randomly selected household has children? • … that a randomly selected household has fewer than 3 children? • … no more than 3 children?
Theoretical Probabilities Rolling one die Total of rolling two dice
Tossing coin and counting Heads One Coin Four Coins
Tossing coin and counting Heads How did we get this? Four Coins • Could try to list the entire sample space: TTTT, TTTH, TTHT, TTHH, THTT, etc. • Could use a tree diagram to get the sample space. • Could use nCr combinations. • We will formally study The Binomial Distribution soon.
Graphical Representation Histogram, for example Four Coins Probability 6/16 4/16 1/16 0 1 2 3 4 heads
Shape of the distribution Histogram, for example Distribution shapes matter! This one is a bell-shaped distribution Rolling a single die: its graph is a uniform distribution Other distribution shapes can happen, too Probability 6/16 3/16 1/16 0 1 2 3 4 heads