Chapter Discrete Probability Distributions
3. 6. Chapter Discrete Probability Distributions. © 2010 Pearson Prentice Hall. All rights reserved. Section 6.1 Probability Rules.

Chapter Discrete Probability Distributions
E N D
Presentation Transcript
3 6 Chapter Discrete Probability Distributions © 2010 Pearson Prentice Hall. All rights reserved
Section 6.1 Probability Rules © 2010 Pearson Prentice Hall. All rights reserved
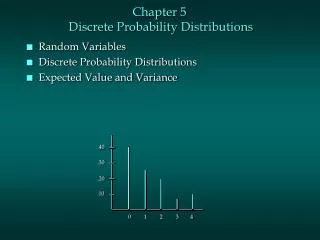
A random variable is a numerical measure of the outcome from a probability experiment, so its value is determined by chance. Random variables are denoted using letters such as X. © 2010 Pearson Prentice Hall. All rights reserved
A discrete random variable has either a finite or countable number of values. The values of a discrete random variable can be plotted on a number line with space between each point. See the figure. © 2010 Pearson Prentice Hall. All rights reserved
A continuous random variable has infinitely many values. The values of a continuous random variable can be plotted on a line in an uninterrupted fashion. See the figure. © 2010 Pearson Prentice Hall. All rights reserved
EXAMPLE Distinguishing Between Discrete and Continuous Random Variables • Determine whether the following random variables are discrete or continuous. State possible values for the random variable. • The number of light bulbs that burn out in a room of 10 light bulbs in the next year. • (b) The number of leaves on a randomly selected Oak tree. • (c) The length of time between calls to 911. Discrete; x = 0, 1, 2, …, 10 Discrete; x = 0, 1, 2, … Continuous; t > 0 © 2010 Pearson Prentice Hall. All rights reserved
Classify the following random variable according to whether it is discrete or continuous. The number of goals scored in a soccer game (a) Discrete (b) Continuous (c) Not sure © 2010 Pearson Prentice Hall. All rights reserved
A random variable is (a) A numerical measure of the outcome of a probability experiment. (b) A qualitative attribute of a population. (c) The variable for which an algebraic equation is solved. (d) Generated by a random number table. (e) Not sure © 2010 Pearson Prentice Hall. All rights reserved
A probability distribution provides the possible values of the random variable X and their corresponding probabilities. A probability distribution can be in the form of a table, graph or mathematical formula. © 2010 Pearson Prentice Hall. All rights reserved
EXAMPLE A Discrete Probability Distribution The table to the right shows the probability distribution for the random variable X, where X represents the number of DVDs a person rents from a video store during a single visit. © 2010 Pearson Prentice Hall. All rights reserved
EXAMPLE Identifying Probability Distributions Is the following a probability distribution? © 2010 Pearson Prentice Hall. All rights reserved
EXAMPLE Identifying Probability Distributions Is the following a probability distribution? © 2010 Pearson Prentice Hall. All rights reserved
EXAMPLE Identifying Probability Distributions Is the following a probability distribution? © 2010 Pearson Prentice Hall. All rights reserved
Does the following table describe a discrete probability distribution? (a) No, because –1 is not allowed as a value for x (b) No, because the probabilities do not sum to 1 (c) No, because the probabilities are not in order (d) Yes, the probabilities are all positive and sum to 1 (e) Not sure © 2010 Pearson Prentice Hall. All rights reserved
A probability histogram is a histogram in which the horizontal axis corresponds to the value of the random variable and the vertical axis represents the probability of that value of the random variable. © 2010 Pearson Prentice Hall. All rights reserved
EXAMPLE Drawing a Probability Histogram Draw a probability histogram of the probability distribution to the right, which represents the number of DVDs a person rents from a video store during a single visit. © 2010 Pearson Prentice Hall. All rights reserved
EXAMPLE Computing the Mean of a Discrete Random Variable Compute the mean of the probability distribution to the right, which represents the number of DVDs a person rents from a video store during a single visit. © 2010 Pearson Prentice Hall. All rights reserved
The following data represent the number of DVDs rented by 100 randomly selected customers in a single visit. Compute the mean number of DVDs rented. © 2010 Pearson Prentice Hall. All rights reserved
As the number of trials of the experiment increases, the mean number of rentals approaches the mean of the probability distribution. © 2010 Pearson Prentice Hall. All rights reserved
The mean of the discrete random variable defined in the table below is approximately © 2010 Pearson Prentice Hall. All rights reserved
Because the mean of a random variable represents what we would expect to happen in the long run, it is also called the expected value, E(X), of the random variable. © 2010 Pearson Prentice Hall. All rights reserved
EXAMPLE Computing the Expected Value of a Discrete Random Variable A term life insurance policy will pay a beneficiary a certain sum of money upon the death of the policy holder. These policies have premiums that must be paid annually. Suppose a life insurance company sells a $250,000 one year term life insurance policy to a 49-year-old female for $530. According to the National Vital Statistics Report, Vol. 47, No. 28, the probability the female will survive the year is 0.99791. Compute the expected value of this policy to the insurance company. Survives Does not survive E(X) = 530(0.99791) + (-249,470)(0.00209) = $7.50 © 2010 Pearson Prentice Hall. All rights reserved
EXAMPLE Computing the Variance and Standard Deviation of a Discrete Random Variable Compute the variance and standard deviation of the following probability distribution which represents the number of DVDs a person rents from a video store during a single visit. © 2010 Pearson Prentice Hall. All rights reserved
Section 6.2 The Binomial Probability Distribution © 2010 Pearson Prentice Hall. All rights reserved
Criteria for a Binomial Probability Experiment An experiment is said to be a binomial experiment if 1. The experiment is performed a fixed number of times. Each repetition of the experiment is called a trial. 2. The trials are independent. This means the outcome of one trial will not affect the outcome of the other trials. 3. For each trial, there are two mutually exclusive (or disjoint) outcomes, success or failure. 4. The probability of success is fixed for each trial of the experiment. © 2010 Pearson Prentice Hall. All rights reserved
Notation Used in the Binomial Probability Distribution • There are n independent trials of the experiment • Let p denote the probability of success so that 1 – p is the probability of failure. • Let X be a binomial random variable that denotes the number of successes in n independent trials of the experiment. So, 0 <x<n. © 2010 Pearson Prentice Hall. All rights reserved
EXAMPLE Identifying Binomial Experiments • Which of the following are binomial experiments? • A player rolls a pair of fair die 10 times. The number X of 7’s rolled is recorded. • (b) The 11 largest airlines had an on-time percentage of 84.7% in November, 2001 according to the Air Travel Consumer Report. In order to assess reasons for delays, an official with the FAA randomly selects flights until she finds 10 that were not on time. The number of flights X that need to be selected is recorded. • (c) In a class of 30 students, 55% are female. The instructor randomly selects 4 students. The number X of females selected is recorded. Binomial experiment Not a binomial experiment – not a fixed number of trials. Not a binomial experiment – the trials are not independent. © 2010 Pearson Prentice Hall. All rights reserved
Decide whether the experiment is a binomial experiment. If it is not, explain why. Testing a pain reliever using 400 people to determine if it is effective. The random variable represents the number of people who find the pain reliever to be effective. • A binomial experiment • Not a binomial experiment • Not sure © 2010 Pearson Prentice Hall. All rights reserved
A random sample of 12 students reports how many brothers they have. Is this a binomial experiment? (a) Yes, because the students are independent (b) Yes, because the probabilities are the same for each trial (c) No, because sisters are excluded (d) No, because the successes are not limited to one “success” or one “failure (e) Not sure © 2010 Pearson Prentice Hall. All rights reserved
EXAMPLE Constructing a Binomial Probability Distribution According to the Air Travel Consumer Report, the 11 largest air carriers had an on-time percentage of 79.0% in May, 2008. Suppose that 4 flights are randomly selected from May, 2008 and the number of on-time flights X is recorded. Construct a probability distribution for the random variable X using a tree diagram. © 2010 Pearson Prentice Hall. All rights reserved
EXAMPLE Using the Binomial Probability Distribution Function • According to the Experian Automotive, 35% of all car-owning households have three or more cars. • In a random sample of 20 car-owning households, what is the probability that exactly 5 have three or more cars? • (b) In a random sample of 20 car-owning households, what is the probability that less than 4 have three or more cars? • (c) In a random sample of 20 car-owning households, what is the probability that at least 4 have three or more cars? © 2010 Pearson Prentice Hall. All rights reserved
According to government data, the probability that an adult was never married is 15%. In a random survey of 10 adults, what is the probability that two were never married? © 2010 Pearson Prentice Hall. All rights reserved
According to government data, the probability that an adult was never married is 15%. In a random survey of 10 adults, what is the probability that less than 2 were never married? © 2010 Pearson Prentice Hall. All rights reserved
EXAMPLE Finding the Mean and Standard Deviation of a Binomial Random Variable According to the Experian Automotive, 35% of all car-owning households have three or more cars. In a simple random sample of 400 car-owning households, determine the mean and standard deviation number of car-owning households that will have three or more cars. © 2010 Pearson Prentice Hall. All rights reserved
According to government data, the probability that an adult was never married is 15%. In a random survey of 500 adults, what is the expected number who were never married? © 2010 Pearson Prentice Hall. All rights reserved