Download
1 / 11
110 likes | 248 Vues
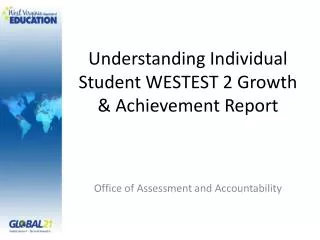
Understanding Individual Student WESTEST 2 Growth & Achievement Report. Office of Assessment and Accountability. Meet the Student Growth and Achievement Report. Hello. It’s nice to meet you. Hello, Growth Report. Name of Student. Name of School. Interpretation Guide.

E N D
Understanding Individual Student WESTEST 2 Growth & Achievement Report Office of Assessment and Accountability
Meet the Student Growthand Achievement Report Hello. It’s nice to meet you. Hello, Growth Report
Name of Student Name of School Interpretation Guide Growth and Achievement for Math Growth and Achievement for R/LA Suggested Uses Partial Mastery Partial Mastery Mastery Novice
Scale Scores for Math Scale Scores for R/LA WESTEST 2 Achievement Levels WESTEST 2 Achievement Levels Grade Level and School Year Grade Level and School Year Legend for Math Student Achievement Levels Student Achievement Levels Legend for R/LA Partial Mastery Partial Mastery Mastery Novice
The colored arrows between the dots represent growth from one grade to the next. The color of the arrow signifies the level of growth. The fan represents how the student might score next year under several growth scenarios. High growth is indicated in green, typical growth in white, and low growth in red. Growth Percentiles Growth Levels Partial Mastery Partial Mastery Mastery Novice
Is it enough growth? How much growth?
How much growth? Growth Percentile – 1% to 99% • 66%-99% = High Growth = Green Arrow - Good surprise - the student exceeded what was expected • 35%-65% = Typical Growth = White Arrow - Statistical expectation - the student grew as expected • 1%-34% = Low Growth = Red Arrow - Bad surprise – The student grew less than was expected
Is it enough growth? Will a student be proficient next year? • Determined at only one grade level at a time • Depends on the achievement level where the student was at a particular grade level • The fan can help us understand potential stories for a given student • What level of growth is required for a student who is proficient to keep up with proficiency next year? • What level of growth is required for a student who is not proficient to catch up to proficiency next year? • What level of growth for any student, would cause a student to fall or stay below proficiency next year?
Prior Proficient: Student is Not Keeping Up/ Falling Behind (Math)
Prior Proficient: Student Keeping Up (Math)/ Will Fall Behind (R/LA)