CARDIAC CYCLE
CARDIAC CYCLE. DR RAKESH JAIN SR Cardiology Govt. Medical College, Calicut. Cardiac Cycle. Def: The cardiac events that occur from beginning of one heart beat to the beginning of the next. first assembled by Lewis in 1920 but first conceived by Wiggers in 1915.

CARDIAC CYCLE
E N D
Presentation Transcript
CARDIAC CYCLE DR RAKESH JAIN SR Cardiology Govt. Medical College, Calicut.
Cardiac Cycle • Def: The cardiac events that occur from beginning of one heart beat to the beginning of the next. • first assembled by Lewis in 1920 but first conceived by Wiggers in 1915
Atria act as PRIMER PUMPS for ventricles & ventricles provide major source of power for moving the blood through the vascular system. • Initiated by spontaneous generation of AP in SA node (located in the superior lateral wall of the right atrium near the opening of the superior vena cava)
Electrical System: Brief • Action potentials originating • in the sinus node travel to • AV node (1m/s) in 0.03 sec.
AV nodal delay of 0.09 sec before the impulse • enters the penetrating portion of the A-V bundle • 2. A final delay of another 0.04 sec occurs mainly in • this penetrating A-V bundle • total delay in the A-V nodal and A-V bundle • system is about 0.13 sec • A total delay of 0.16 sec occurs before the excitatory • signal finally reaches the contracting muscle of the • ventricles from its origin in sinus node.
Delay in AV node (0.13sec) • Why delay? Diminished numbers of gap junctions Between successive cells in the conducting pathways. • Significance? Delay allows time for the atria to empty their blood into the ventricles before ventricular contraction begins
Rapid Transmission in the Purkinje System (1.5 to 4.0 m/sec) i.e. • About 6x that in ventricular muscle • About 150x that in A-V nodal fibers allowing almost instantaneous transmission of the cardiac impulse throughout the ventricular muscle • (B/c of very high level of permeability of the gap junctions)
Cardiac cycle – basically describes… • Pressure • Volume, and • Flow phenomenon in ventricles as a function of time
Basics • 1 Beat = 0.8 sec (800 msec) • Systole = 0.3 sec • Diastole = 0.5 sec In tachycardia, Diastolic phase decreases more than systolic phase
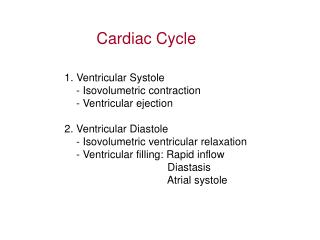
Phases of cardiac cycle LV Contraction Isovolumic contraction (b) Maximal ejection (c) LV Relaxation Start of relaxation and reduced ejection (d) Isovolumic relaxation (e) LV Filling Rapid phase (f) Slow filling (diastasis) (g) Atrial systole or booster (a)
Time Intervals Total ventricular systole 0.3 sec • Isovolumic contraction (b) 0.05 sec (0.015sec for RV) • Maximal ejection (c) 0.1 sec • Reduced ejection (d) 0.15 sec Total ventricular diastole 0.5 sec • Isovolumic relaxation (e) 0.1 sec • Rapid filling phase (f) 0.1 sec • Slow filling (diastasis) (g) 0.2 sec • Atrial systole or booster (a) 0.1 sec GRAND TOTAL (Syst+Diast) = 0.8 sec
Physiologic Versus Cardiologic Systole and Diastole 20msec Physiological systole
cardiologic systole, demarcated by heart sounds rather than by physiologic events, starts fractionally later than physiologic systole and ends significantly later. Cardiologic systole> physiologic systole
Description of Cardiac cycle phases • Pressure & Volume events • ECG correlation • Heart sounds • Clinical significance
Atrial SystoleA-V Valves Open; Semilunar Valves Closed • Blood normally flows continually from great veins into atria • 80% flows directly thr atria into ventricle before the atria contracts. • 20% of filling of ventricles – atrial contraction • Atrial contraction is completed before the ventricle begins to contract.
Atrial contraction normally accounts for about 10%-15% of LV filling at rest, however, At higher heart rates, atrial contraction may account for up to 40% of LV filling referred to as the "atrial kick” • The atrial contribution to ventricular filling varies inversely with duration of ventricular diastole and directly with atrial contractility
Atrial SystolePressures & Volumes • ‘ a ‘ wave – atrial contraction, when atrial pressure rises. • Atrial pressure drops when the atria stop contracting.
After atrial contraction is complete LVEDV typically about 120 ml (preload) End-diastolic pressures of LV = 8-12 mmHg and RV = 3-6 mmHg • AV valves floats upward (pre-position)
Abnormalities of “a” wave • Elevated a wave Tricuspid stenosis Decreased ventricular compliance (ventricular failure, pulmonic valve stenosis, or pulmonary hypertension) • Cannon a wave Atrial-ventricular asynchrony (atria contract against a closed tricuspid valve) complete heart block, following premature ventricular contraction, during ventricular tachycardia, with ventricular pacemaker • Absent a wave Atrial fibrillation or atrial standstillAtrial flutter
Why blood does not flow back in to SVC/PV while atria contracting, even though no valve in between? • Wave of contraction through the atria moves toward the AV valve thereby having a "milking effect." • Inertial effects of the venous return.
Atrial SystoleECG • p wave – atrial depolarization • impulse from SA node results in depolarization & contraction of atria ( Rt before Lt ) • PR segment – isoelectric line as depolarization proceeds to AV node. • This brief pause before contraction allows the ventricles to fill completely with blood.
Atrial SystoleHeart Sounds • S4 (atrial or presystolic gallop) - atrial emptying after forcible atrial contraction. • appears at 0.04 s after the P wave (late diastolic) • lasts 0.04-0.10 s • Caused by vibration of ventricular wall during rapid atrium emptying into non compliant ventricle
Causes of S4 • Physiological; >60yrs (Recordable, not audible) • Pathological; All causes of concentric LV/RV hypertrophy Coronary artery disease Acute regurgitant lesions An easily audible S4 at any age is generally abnormal.
Clinical Facts about S4 • In contrast to S3, which may mean ventricular failure, the presence of S4 does not indicates heart failure. It only signify “hardworking ventricle”. • The presence of S4 correlate with a gradient of at least 50mmHg across LVOT in suspected LVOT obstruction. (This correlation is not applicable in HCM)
In setting of MI, an audible S4 indicates that at least 10% of myocardium is at jeopardy. • In presence of Shock, S4 indicates that hypovolemia is unlikely as PCWP will be >18mmHg. • S4 can be heard when RVEDP >12mmHg on Rt or LVEDP > 15mmHg on Lt side. If EDP is very high i.e. >25 mmHg, S4 may be absent b/c of insufficient atrial functions.
JVP: x descent • Prominent x descent 1 Cardiac tamponade2 Constrictive pericarditis3 Right ventricular ischemia with preservation of atrial contractility • Blunted x descent 1 Atrial fibrillation2 Right atrial ischemia
Beginning of Ven.SystoleIsovolumetric ContractionAll Valves Closed
Isovolumetric ContractionPressure & Volume Changes • The AV valves close when the pressure in the ventricles (red) exceeds the pressure in the atria (yellow). • As the ventricles contract isovolumetrically -- their volume does not change (white) -- the pressure inside increases, approaching the pressure in the aorta and pulmonary arteries (green). • JVP: c wave- d/t Right ventricular contraction pushes the tricuspid valve into the atrium and increases atrial pressure, creating a small wave into the jugular vein. It is normally simultaneous with the carotid pulse.
Ventricular chamber geometry changes considerably as the heart becomes more spheroid in shape; circumference increases and atrial base-to-apex length decreases. • Early in this phase, the rate of pressure development becomes maximal. This is referred to as maximal dP/dt. • Ventricular pressure increases rapidly LV ~10mmHg to ~ 80mmHg (~Aortic pressure) RV ~4 mmHg to ~15mmHg (~Pulmonary A pressure) At this point, semilunar (aortic and pulmonary) valves open against the pressures in the aorta and pulmonary artery
LV Torsion left-handed helix in subepicardium right-handed helix in subendocardium Figure: Schematic Drawing of LV Torsion The image on the left shows the myofiber directions. Solid lines epicardial region; dashed lines endocardial region. The image on the right shows untwisting. ED end-diastole; ES end-systole; LV left ventricle. (J Am Coll Cardiol Img 2009;2:648–55)
Isovolumetric ContractionECG • The QRS complex is due to ventricular depolarization, and it marks the beginning of ventricular systole.
Isovolumetric ContractionHeart Sounds • S1 is d/t closure and after vibrations of AV Valves. (M1 occurs with a definite albeit 20 msec delay after the LV-LA pressure crossover.) • S1 is normally split (~0.04 sec) because mitral valve closure precedes tricuspid closure. (Heard in only 40% of normal individuals)
S1 heart sound • low pitch and relatively long-lasting • lasts ~ 0.12-0.15 sec • frequency ~ 30-100 Hz • appears 0.02 – 0.04 sec after the beginning of the QRS complex
Some Clinical facts about S1 • S1 is a relatively prolonged, low frequency sound, best heard at apex. • Normally split of S1 (~40%)is heard only at tricuspid area.(As tricuspid component is heard only here.) • If S1 is equal to or higher in intensity than S2 at base, S1 is considered accentuated.
Variable intensity of S1 and jugular venous pulse are highly specific and sensitive in the diagnosis of ventriculoatrial dissociation during VT, and is helpful in distinguishing it from supraventricular tachycardia with aberration. Value of physical signs in the diagnosis of ventricular tachycardia. C J Garratt, M J Griffith, G Young, N Curzen, S Brecker, A F Rickards and A J Camm, Circulation. 1994;90:3103-3107
EjectionAortic and Pulmonic Valves Open; AV Valves Remain Closed • The Semilunar valves ( aortic , pulmonary ) open at the beginning of this phase. • Two Phases • Rapid ejection - 70% of the blood ejected during the first 1/3 of ejection • Slow ejection - remaining 30% of the blood emptying occurs during the latter 2/3 of ejection
Rapid Ejection Pressure & Volume Changes • When ventricles continue to contract , pressure in ventricles exceed that of in aorta & pul arteries & then semilunar valves open, blood is pumped out of ventricles & Ventricular vol decreases rapidly.
Rapid EjectionECG & Heart Sounds • In rapid ejection part of the ejection phase there no specific ECG changes / heart sounds heard.
Slow EjectionAortic and Pulmonic Valves Open; AV Valves Remain Closed • Blood flow from the left ventricle to the aorta rapidly diminishes but is maintained by aortic recoil, the “Windkessel effect “ • At the end of ejection, the semilunar valves close. This marks the end of ventricular systole mechanically.
Slow EjectionECG & Heart Sounds • T wave – slightly before the end of ventricular contraction • it is d/t ventricular repolarization • heart sounds : none
Beginning of DiastoleIsovolumetric relaxationAll Valves Closed • At the end of systole, ventricular relaxation begins, allowing intraventricular pressures to decrease rapidly (LV from 100mmHg to 20mmHg & RV from 15mmHg to 0mmHg), aortic and pulmonic valves abruptly close (aortic precedes pulmonic) causing the second heart sound (S2) • Valve closure is associated with a small backflow of blood into the ventricles and a characteristic notch (incisura or dicrotic notch) in the aortic and pulmonary artery pressure tracings • After valve closure, the aortic and pulmonary artery pressures rise slightly (dicrotic wave) following by a slow decline in pressure
Isovolumetric relaxation • Volumes remain constant because all valves are closed • volume of blood that remains in a ventricle is called the end-systolic volume (LV ~50ml). • pressure & volume of ventricle are low in this phase .
Isovolumetric relaxation • Throughout this and the previous two phases, the atrium in diastole has been filling with blood on top of the closed AV valve, causing atrial pressure to rise gradually • JVP - "v" wave occurs toward end of ventricular contraction – results from slow flow of blood into atria from veins while AV valves are closed .
Isovolumetric relaxationECG & Heart Sounds • ECG : no deflections • Heart Sounds : S2 is heard when the semilunar vlaves close. • A2 is heard prior to P2 as Aortic valve closes prior to pulmonary valve.
Why A2 occurs prior to P2 ? • “Hangout interval” is longer for pulmonary side (~80msec),compared to aortic side (~30msec). Hangout interval is the time interval from crossover of pressures (ventricle with their respective vessel) to the actual occurrence of sound. • Due to lower pressure and higher distensibility, pulmonary artery having longer hangout interval causing delayed PV closure and P2.
S2 heart sound • Appears in the terminal period of the T wave • lasts 0.08 – 0.12s