Hydrology Calibration
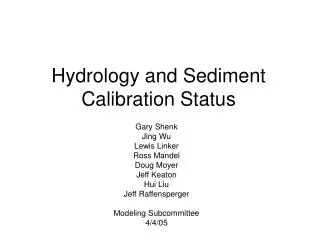
Hydrology Calibration. Phase 5. Calibrators. USGS-MD Jeff Raffensperger Sarah Martucci Joe Vrabel Angelica Gutierrez Gary Fisher. Calibrators. USGS-VA Doug Moyer Alan Simpson Jen Krstolic ICPRB Ross Mandel Julie Kiang. Calibrators. CBP Sara Brandt Jing Wu Kate Hopkins

Hydrology Calibration
E N D
Presentation Transcript
Hydrology Calibration Phase 5
Calibrators • USGS-MD • Jeff Raffensperger • Sarah Martucci • Joe Vrabel • Angelica Gutierrez • Gary Fisher
Calibrators • USGS-VA • Doug Moyer • Alan Simpson • Jen Krstolic • ICPRB • Ross Mandel • Julie Kiang
Calibrators • CBP • Sara Brandt • Jing Wu • Kate Hopkins • Lewis Linker • Gary Shenk
Status • Consistent with other HSPF calibrations in the literature • Better and more consistent overall than phase4 • Reaching point of diminishing returns
Strategy • Water Balance • Stormflow / Baseflow separation • Base Flow • Storm Flow • Seasonal Changes Adapted From: Users Manual for an Expert System (HSPEXP) for Calibration of the Hydrological Simulation Program—Fortran By Lumb, McCammon, and Kittle USGS-WRI Report
Statistics to judge overall calibration • Bias • Base / Storm separation • Recession rates • Model efficiency
Baseflow / Stormflow Stat Fraction of flow that is baseflow (simulated) Bstat = 1 - Fraction of flow that is baseflow (observed) baseflow / total flow (simulated) Bstat = 1 - baseflow / total flow (observed) stormflow / total flow (simulated) Qstat = 1 - stormflow / total flow (observed)
Baseflow / Stormflow Recession Statistic average Simulated recession index Q rec Index = 1 - average Observed recession index quick flow tomorrow ) Average Recession index = Average ( quick flow today
Nash – Sutcliffe Model efficiency (variance of errors) (variance of observed) Computed for daily, log of daily, and monthly values. 1 -
Reported values of N-S efficiency • Often reported, but little information on ‘standards’ of efficiency • Reported daily efficiencies 0.5 - 0.75 • Reported daily log efficiencies 0.5 - 0.75 • Reported monthly efficiencies 0.7 – 0.8
Reported values of N-S efficiency • Often reported, but little information on ‘standards’ of efficiency • Reported daily efficiencies 0.5 - 0.75 • Reported daily log efficiencies 0.5 - 0.75 • Reported Monthly efficiencies 0.7 – 0.8
Reported values of N-S efficiency • Often reported, but little information on ‘standards’ of efficiency • Reported daily efficiencies 0.5 - 0.75 • Reported daily log efficiencies 0.5 - 0.75 • Reported Monthly efficiencies 0.7 – 0.8
Where are we in relation to p4 • Better overall • More consistent parameterization • Calibrated at many more sites
Status • Consistent with other HSPF calibrations in the literature • Better and more consistent overall than phase4 • Reaching point of diminishing returns • Still a few small areas and issues that need attention in hydrology
Ready for Sediment? • River calibration cannot change significantly • Land calibration must have significant surface runoff