Download
1 / 49
510 likes | 696 Vues
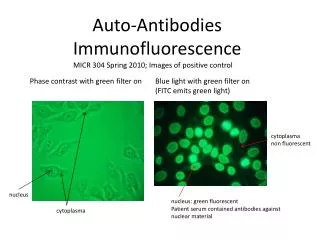
R. L. L. OSWE. P. ARK. L. aboratory. Cancer Institute. of . Flow. Cytometry. DEPARTMENT OF HEALTH, STATE OF NEW YORK. ELM AND CARLTON STREETS. BUFFALO, NY 14263. phone 716-845-8471. FAX 716-845-8806. email:stewart@sc3101.med.buffalo.edu. ANALYSIS OF IMMUNOFLUORESCENCE.

E N D
R L L OSWE P ARK L aboratory Cancer Institute of Flow Cytometry DEPARTMENT OF HEALTH, STATE OF NEW YORK ELM AND CARLTON STREETS BUFFALO, NY 14263 phone 716-845-8471 FAX 716-845-8806 email:stewart@sc3101.med.buffalo.edu ANALYSIS OF IMMUNOFLUORESCENCE AND MULTIPARAMETER DATA Carleton C. Stewart, PhD and Sigrid J. Stewart
CELLULAR ANTIGENS Metabolic Sensory Adhesion
ONE COLOR IMMUNOPHENOTYPING Antibodies Labeled with Fluorescein
SINGLE COLOR IMMUNOFLUORESCENCE • • 1. Ig Block MAB FL-second antibody F(ab') 2 • • 2. Ig Block B-MAB FL-Avidin • 3. Ig Block FL-MAB • = wash
1 1 FSC 80 2 1 SSC 100 3 1 Green 40 4 1 20 Red 5 2 90 FSC 6 2 120 SSC 7 2 100 Green 8 2 110 Red - n 50 FSC - n 75 SSC - n 110 Green k n 120 Red CORRELATED (LIST MODE) DATA ACQUISITION Entry No. Value Cell Number Parameter
A REGION A B C forward scatter CD4 fluorescence NUMBER OF CELLS REGION C REGION B CD4 fluorescence
WAYS ANTIBODIES BIND TO CELLS Specific: Fab to epitope Fc to Fc receptor binding is high affinity and saturable Non Specific: binding is low affinity and not saturable
Specific Activity is the concentration of bindable antibody to its epitope divided by the protein concentration. SA = {F(ab')2} (protein)
Reasons antibodies do not bind to cells: 1. overconjugation 2. not purified 3. degradation of binding site 4. aggregation
Storing of antibodies: Proteases destroy antibodies in: • ascitic fluid • serum • bacteria Use sodium azide Use highly purified albumin or gelatin as carrier Purify antibodies in ascitic fluid immediately
VERIFICATION OF BLOCK • FcR and non-specific binding FL-MAB + PE-mIgG gIgG + FL-MAB + PE-mIgG
EFFECT OF BLOCKING ON MAB BINDING TO MONONUCLEAR CELLS L O G F L U O R E S C E N C E CELL VOLUME
UNBLOCKED R E L A T I 1µg V E N U M B 3 µg E R O F 9 µg C E L L S 0 64 128 192 256 CHANNEL NUMBER
SECOND REAGENT QUALITY F(ab’)2of anti IgG log fluorescence anti IgG cell volume
VARIATION IN GAMMA 1 MYELOMA PROTEIN BINDING TO MACROPHAGES PERCENT POSITIVE
DEAD CELLS CAN BE A PROBLEM • They bind antibodies nonspecifically • They masquerade as specific subsets • They cause data misinterpretation
4 4 10 10 3 3 10 10 2 2 10 10 1 1 10 10 0 0 10 10 0 1 3 2 4 0 1 3 2 4 10 10 10 10 10 10 10 10 10 10 ANTIBODIES BIND NON-SPECIFICALLY TO DEAD CELLS VIABLE CELLS ALL CELLS A B dead cells PE-LAMBDA FL-KAPPA
EVALUATING VIABILITY WITH ETHIDIUM MONOAZIDE EMA forward scatter
TWO COLOR IMMUNOPHENOTYPING Antibodies labeled with fluorescein Antibodies labeled with phycoerythrin
4 4 10 10 3 3 10 10 2 2 10 10 1 1 10 10 0 0 10 10 0 1 3 2 4 0 1 3 2 4 10 10 10 10 10 10 10 10 10 10 uncompensated compensated fluorescence 2 fluorescence 1
4 4 10 10 3 3 10 10 2 2 10 10 1 1 10 10 0 0 10 10 0 1 3 2 4 0 1 3 2 4 10 10 10 10 10 10 10 10 10 10 4 10 3 10 2 10 1 10 0 10 0 1 3 2 4 10 10 10 10 10 COMPENSATION IS INTENSITY DEPENDENT partially compensated uncompensated fluorescence 2 fully compensated fluorescence 1
TWO COLOR IMMUNOFLUORESCENCE 1. Ig Block + MAB • FL-second antibody F(ab’) • Ig Block + PE-MAB• 2. Ig Block + B-MAB + FL -MAB • PE-Avidin • 3. Ig Block + FL-MAB + PE-MAB •
COMBINED INDIRECT AND DIRECT IMMUNOFLUORESCENCE STAINING NO BLOCKING Primary Antibody: mMAB Second Antibody: FGAM PE-mMAB
4 4 10 10 3 3 10 10 2 2 10 10 1 1 10 10 0 0 10 10 NO BLOCK BLOCK 21% 12% CD8 + FGAM CD8 + FGAM 42% 49% 6% 0 1 3 2 4 0 1 3 2 4 10 10 10 10 10 10 10 10 10 10 PE-CD4 PE-CD4
VERIFICATION OF BLOCK Second Reagent Block gIg + MAB • FL-GAM • PE-mIg gIg + MAB • FL-GAM • mIg + PE-mIg
THREE COLOR IMMUNOPHENOTYPING Fluorescein Antibodies labeled with Phycoerythrin Antibodies labeled with Tandem Complex Antibodies labeled with to Avidin Tandem Complexes are Texas Red or CY 5 coupled to Phycoerythrin Per CP is a natural Tandem Complex of peridinin and chlorophyll a protein
0 1 0 1 3 3 2 2 4 4 0 1 3 2 4 10 10 10 10 10 10 10 10 10 10 10 10 10 10 10 SINGLE COLOR HISTOGRAMS number of cells CD4 CD3 CD8
4 4 10 10 3 3 10 10 2 2 10 10 1 1 10 10 0 0 10 10 0 1 3 2 4 0 1 3 2 4 10 10 10 10 10 10 10 10 10 10 TWO COLOR PATTERN A B CD4 CD8 CD3 CD3
4 10 3 10 2 10 1 10 0 10 0 1 3 2 4 10 10 10 10 10 4 4 10 10 3 3 10 10 2 2 10 10 1 1 10 10 0 0 10 10 0 1 3 2 4 0 1 3 2 4 10 10 10 10 10 10 10 10 10 10 THREE COLOR PATTERN ALL CELLS ALL CELLS A B SSC CD4 FSC CD3 ALL CELLS CD3+ CELLS C D CD8 CD8 CD4 CD4
POPULATIONS RESOLVED BY THREE ANTIBODIES up to 8 populations can be resolved for each additional panel FL-Ab PE-Ab TC-Ab + + + + + - + - + + - - FL-Ab PE-Ab TC-Ab - + + - + - - - + - - -
THREE COLOR IMMUNOFLUORESCENCE 1. Ig Block + MAB• B- second antibody F(ab') 2 • Ig Block + FL- MAB + PE-MAB + TC- Avidin • 2. Ig Block + FL-MAB + PE-MAB + B-MAB • TC-Avidin • 3. Ig Block + FL-MAB + PE-MAB + TC-MAB • TC(third color) = PE/TR or PE/CY5 tandem or PerCP
STRATEGY FOR SELECTING FLUOROCHROME: EPITOPE DENSITY FLUOROCHROME Low phycoerythrin low-intermediate tandem high fluorescein
COMPENSATE INSTRUMENT USING STAINED CELLS 1. Adjust PMT voltages using unstained cells 2. Adjust compensation for each fluorochrome
4 4 10 10 3 3 10 10 2 2 10 10 1 1 10 10 0 0 10 10 0 1 0 1 3 3 2 2 4 4 10 10 10 10 10 10 10 10 10 10 THREE COLOR COMPENSATION half each side half each side PE-CD4 PE-CD4 FL-CD45 TC-CD8
4 4 10 10 3 3 10 10 2 2 10 10 1 1 10 10 0 0 10 10 0 1 0 1 3 3 2 2 4 4 10 10 10 10 10 10 10 10 10 10 4 4 10 10 3 3 10 10 2 2 10 10 1 1 10 10 0 0 10 10 0 1 0 1 3 3 2 2 4 4 10 10 10 10 10 10 10 10 10 10 CELLULAR COMPENSATION STANDARD CURRENT PE-CD4 PREVIOUS FL-CD45 TC-CD8
THREE COLOR SOP 50 µl washed, and lyse, blocked* centrifuge, whole blood or decant, bone marrow blot, and resuspend pellet wash, FL-mab fix, + and PE-mab 15 min. on ice analyse + TC-mab *add 10 µl mIg (10 mg/ml) to 1 ml washed whole blood.
THIRD COLOR REAGENT PROPERTIES TO CONSIDER • monocyte binding PE-CY5 • light sensitivity PE-CY5 and PerCP • batch variation PE-TR and PE-CY5
LEUKEMIA GATE USING CD45 NORMAL BONE MARROW 0 256 512 768 1024 SSC -> /6/05133061 0 1 2 3 4 10 10 10 10 10 HLADr -> /6/05133061
LEUKEMIA GATE USING CD45 LEUKEMIC (TALL) BONE MARROW 0 256 512 768 1024 SSC -> /7/06064121 0 1 2 3 4 10 10 10 10 10 HLADr -> /7/06064121